OUR DESIGN PARAMETERS & EFFECT SIZE BENCHMARKS
Without good estimates, power analysis is only guesswork.
— David M. Murray (1998, p. 350)
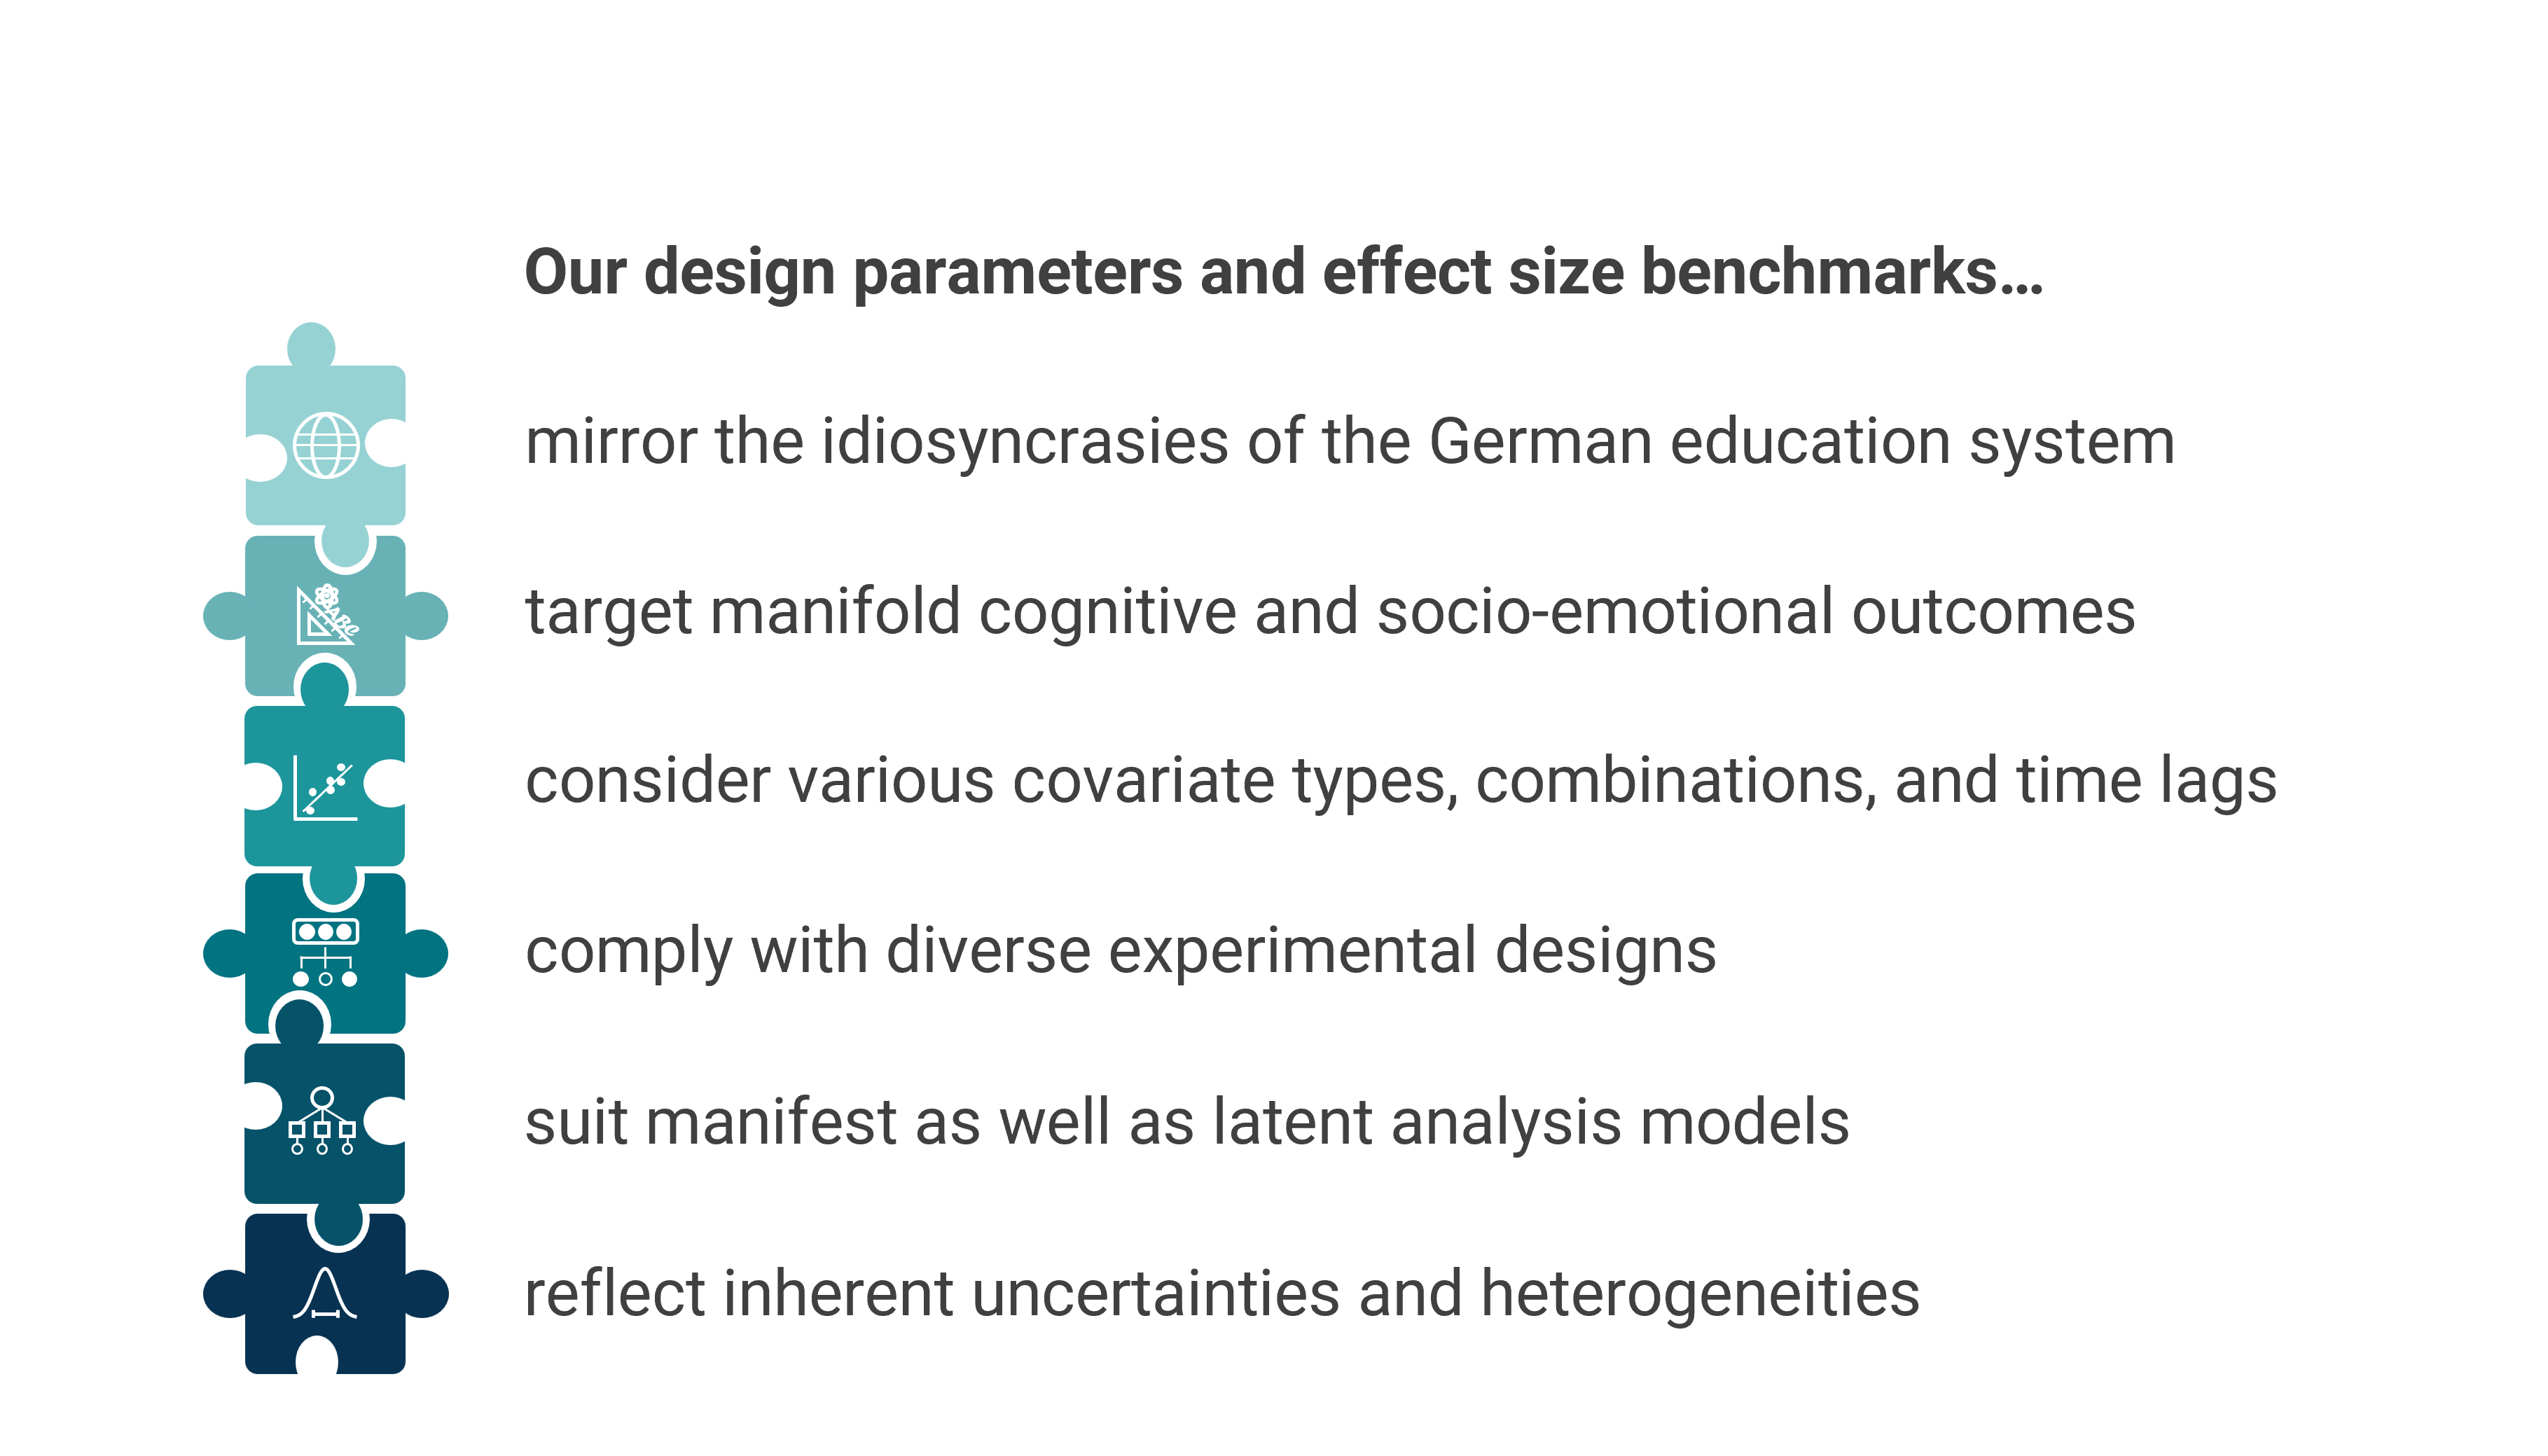
The virtue of a power analysis stands or falls with the quality of its input—true to the motto, “garbage in, garbage out.” Reasonable assumptions on design parameters and effect sizes are therefore key to planning strong experimental studies. Design parameters reflect the (clustered) variance structure of the interventions’ target outcome. They include intraclass correlation coefficients (ICCs) ρ that quantify outcome differences between clusters and R2 values that quantify the proportions of explained variance by covariates (at various levels).
Basically, the estimates entered into power computations should match the features of the planned RT: its target population, the outcome of interest, the hierarchical structure and randomization scheme, the ensuing analysis, and any applied covariates (e.g., Bloom et al., 2007; Campbell et al., 2000; Cohen, 1988; Hedges & Hedberg, 2007; Lipsey et al., 2012; Murray, 1998; Schochet, 2008; Spybrook et al., 2016; Zhang et al., 2023). However, since the true quantities are unknown a priori by definition, the assumed values for design parameters and effect sizes are inevitably subject to uncertainty, no matter how informed and (empirically and theoretically) justified a researcher’s assumptions are (this is also referred to as the local optimization problem, Du & Wang (2016); Moerbeek & Teerenstra (2016)].
To optimally support evaluation researchers in designing strong RTs that allow valid causal inferences about educational and psychological interventions, we have compiled extensive databases and resources of versatile single- and multilevel design parameters and effect size benchmarks (and corresponding standard errors), along with concise application and selection guidance.
There are several resources for empirical estimates of ρ and R2 for educational and psychological outcomes. An overview of existing international and German research on design parameters for student achievement can be found in Stallasch (2024), and – in more detail/meta-analytically aggregated – in Stallasch et al. (2021)/Stallasch et al. (2024). The research review in Brunner et al. (2025) also addresses socio-emotional learning outcomes. Similarly, Brunner et al. (2023) summarize available effect size benchmarks for student achievement.
Design Parameters for the German School Context
Stallasch et al. (2021)
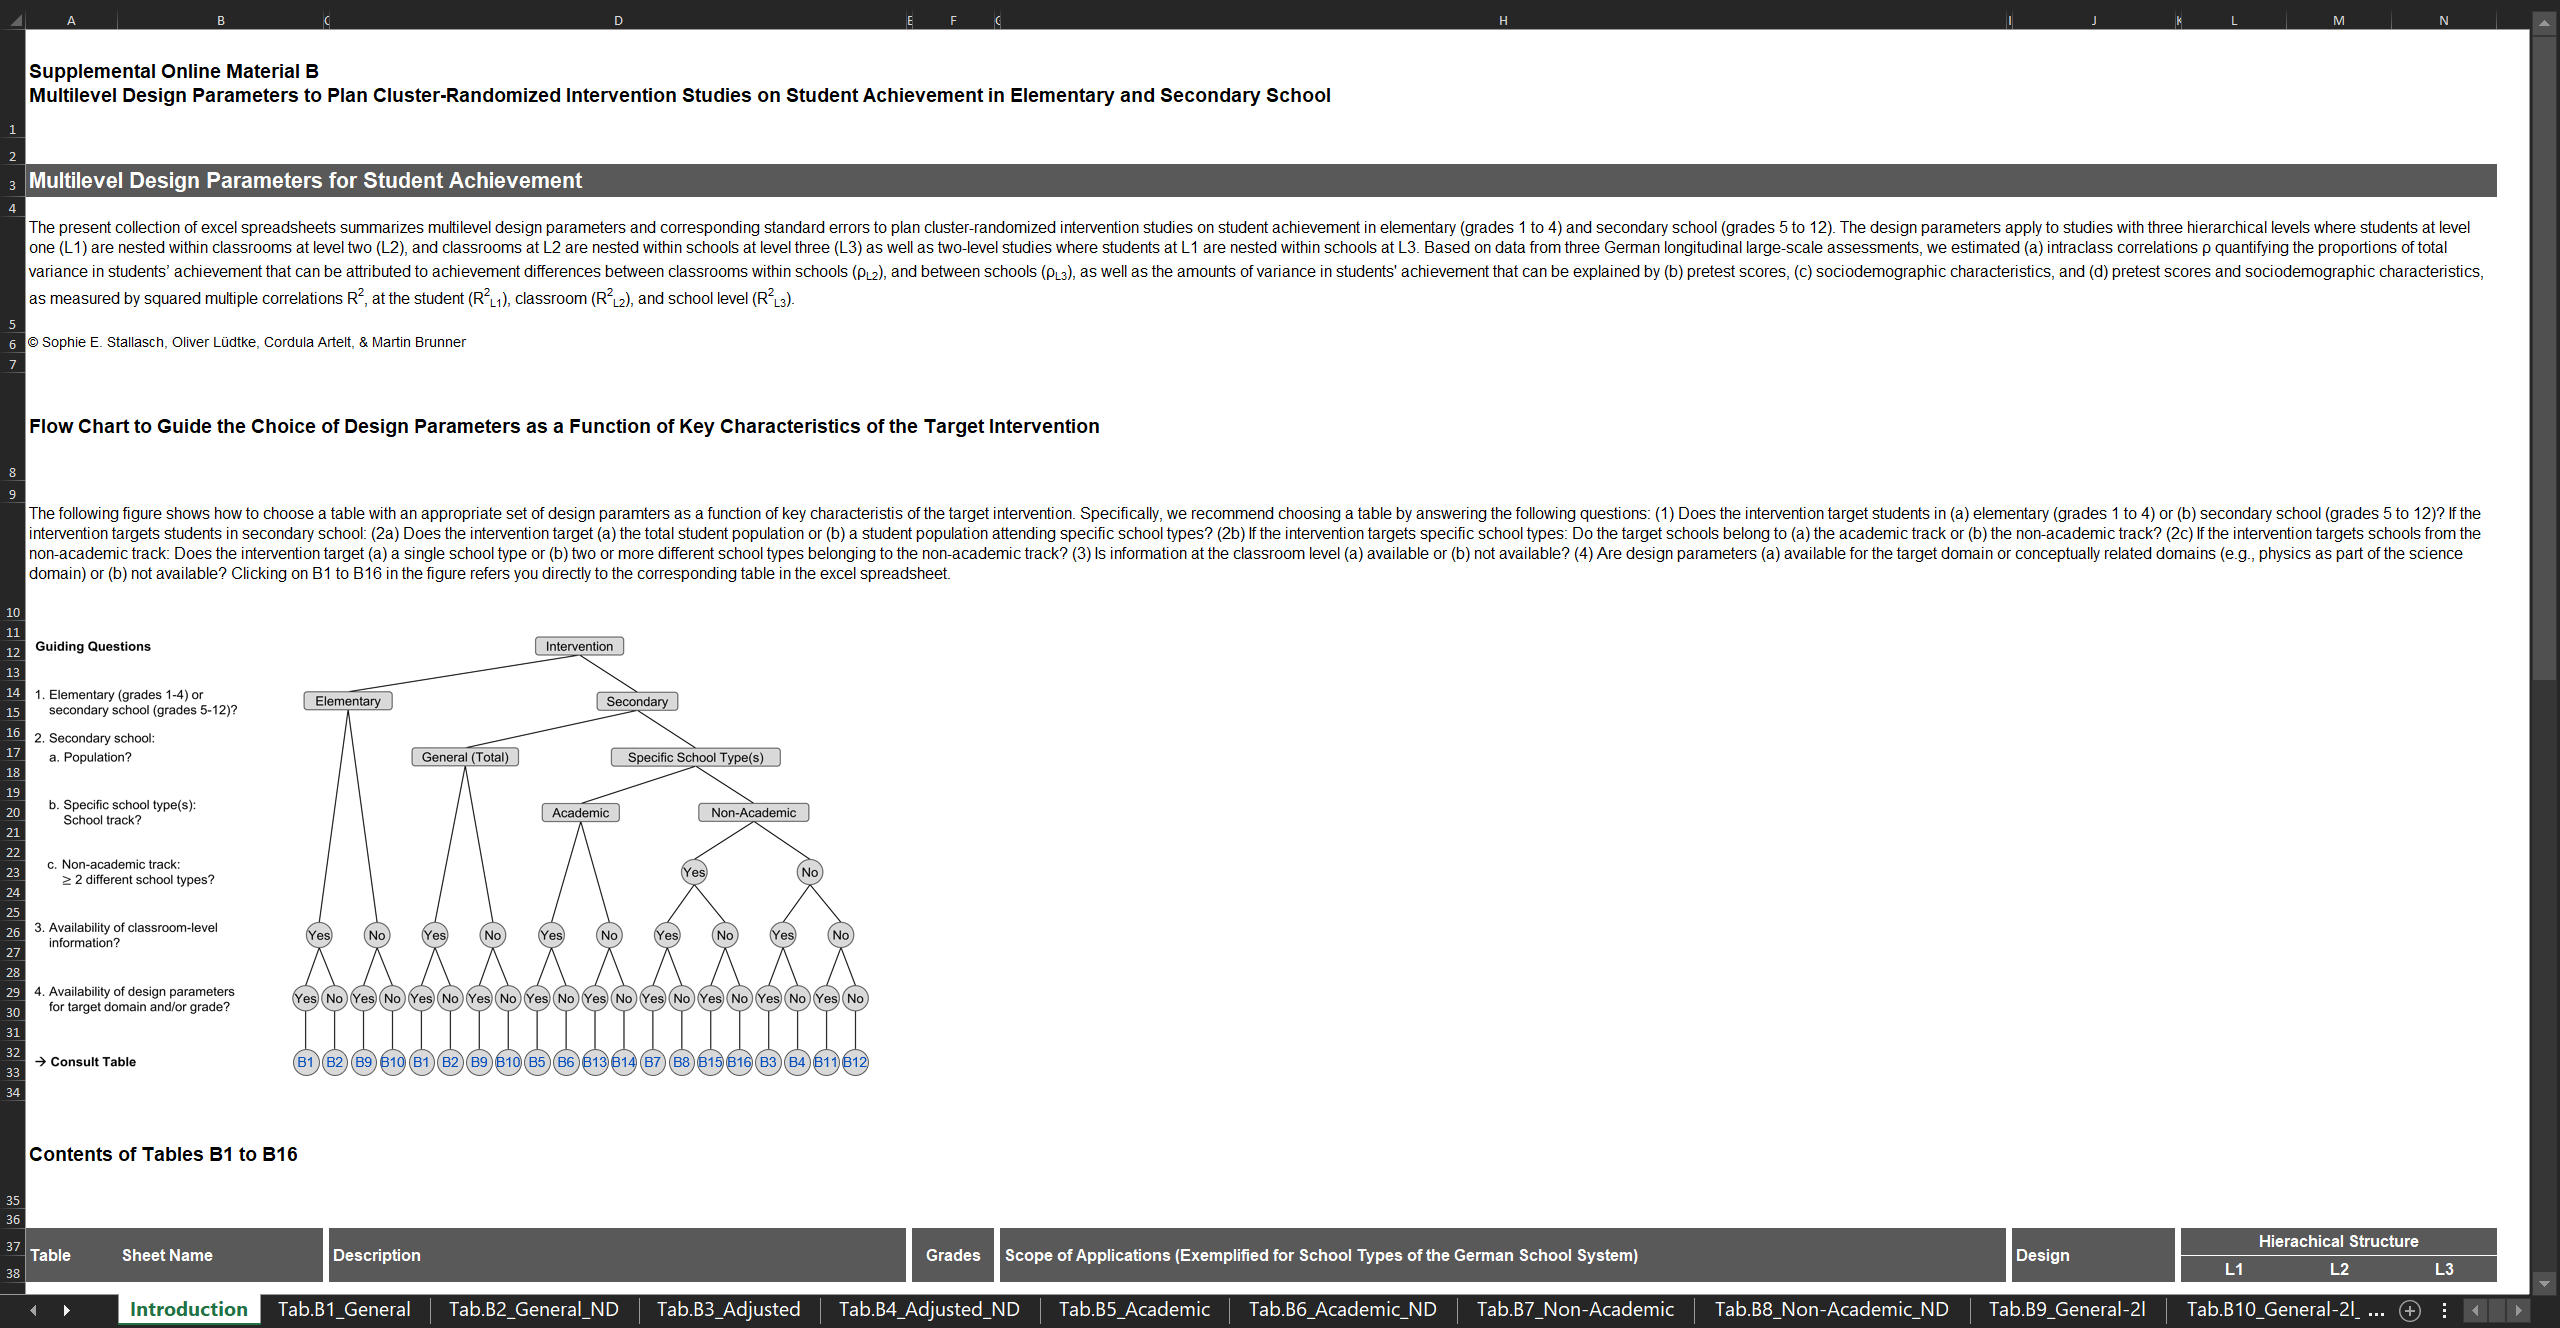
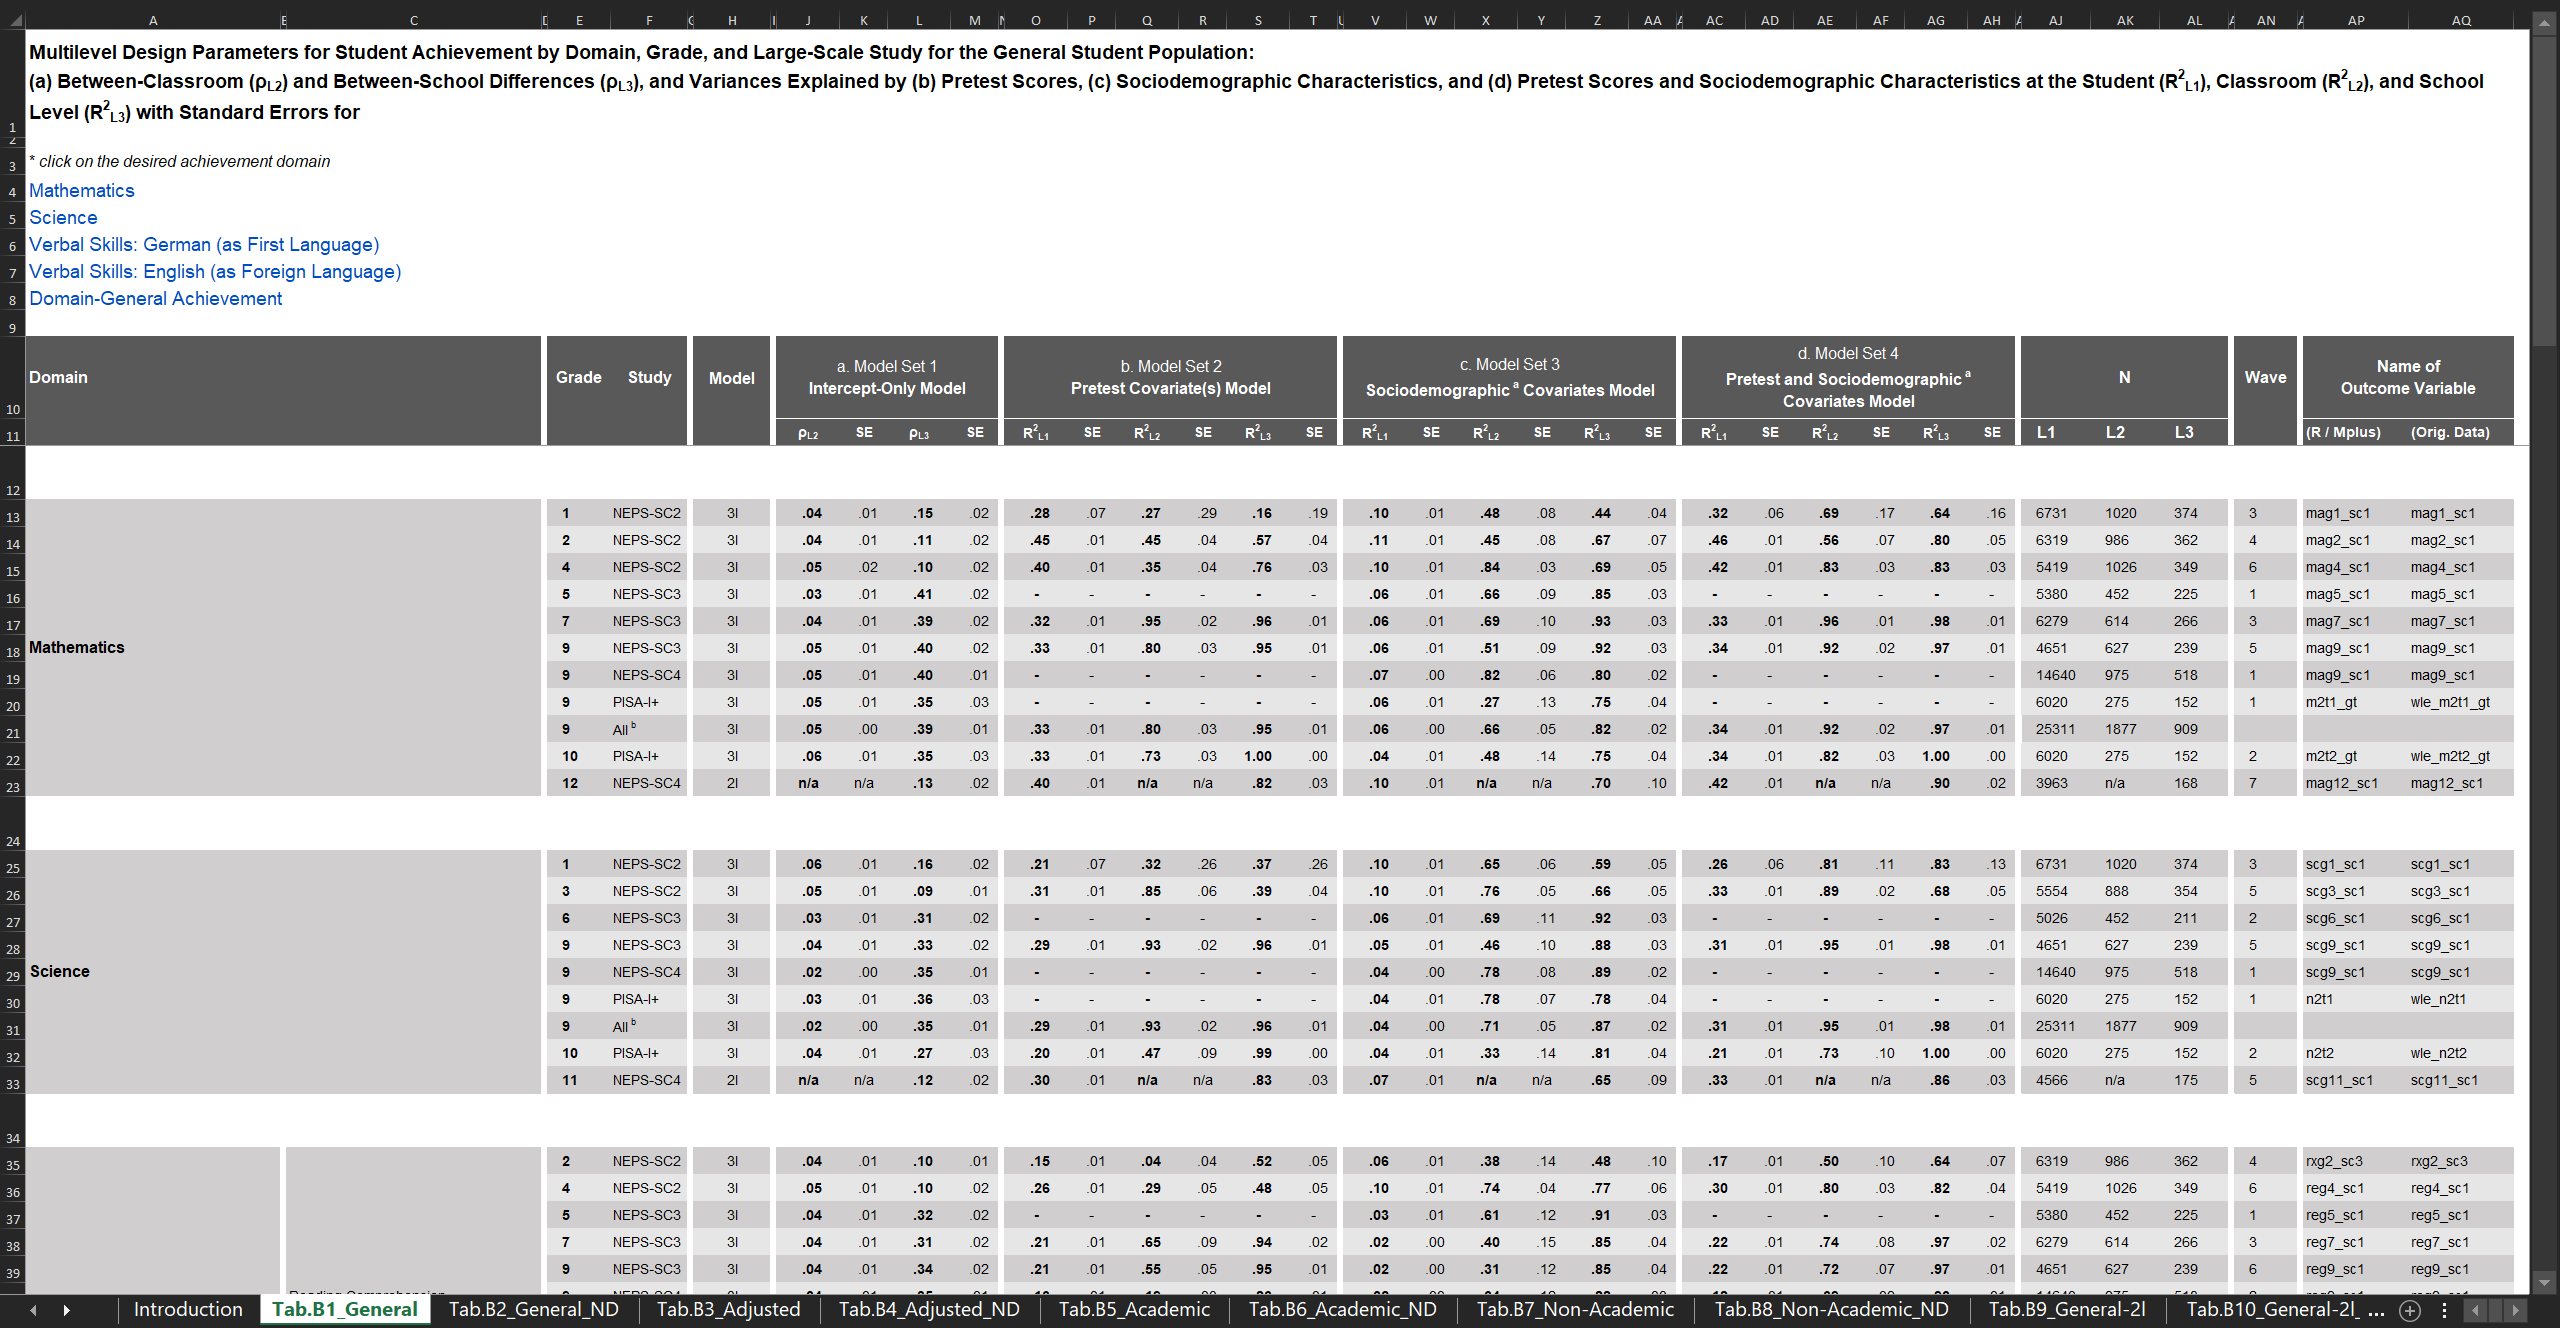
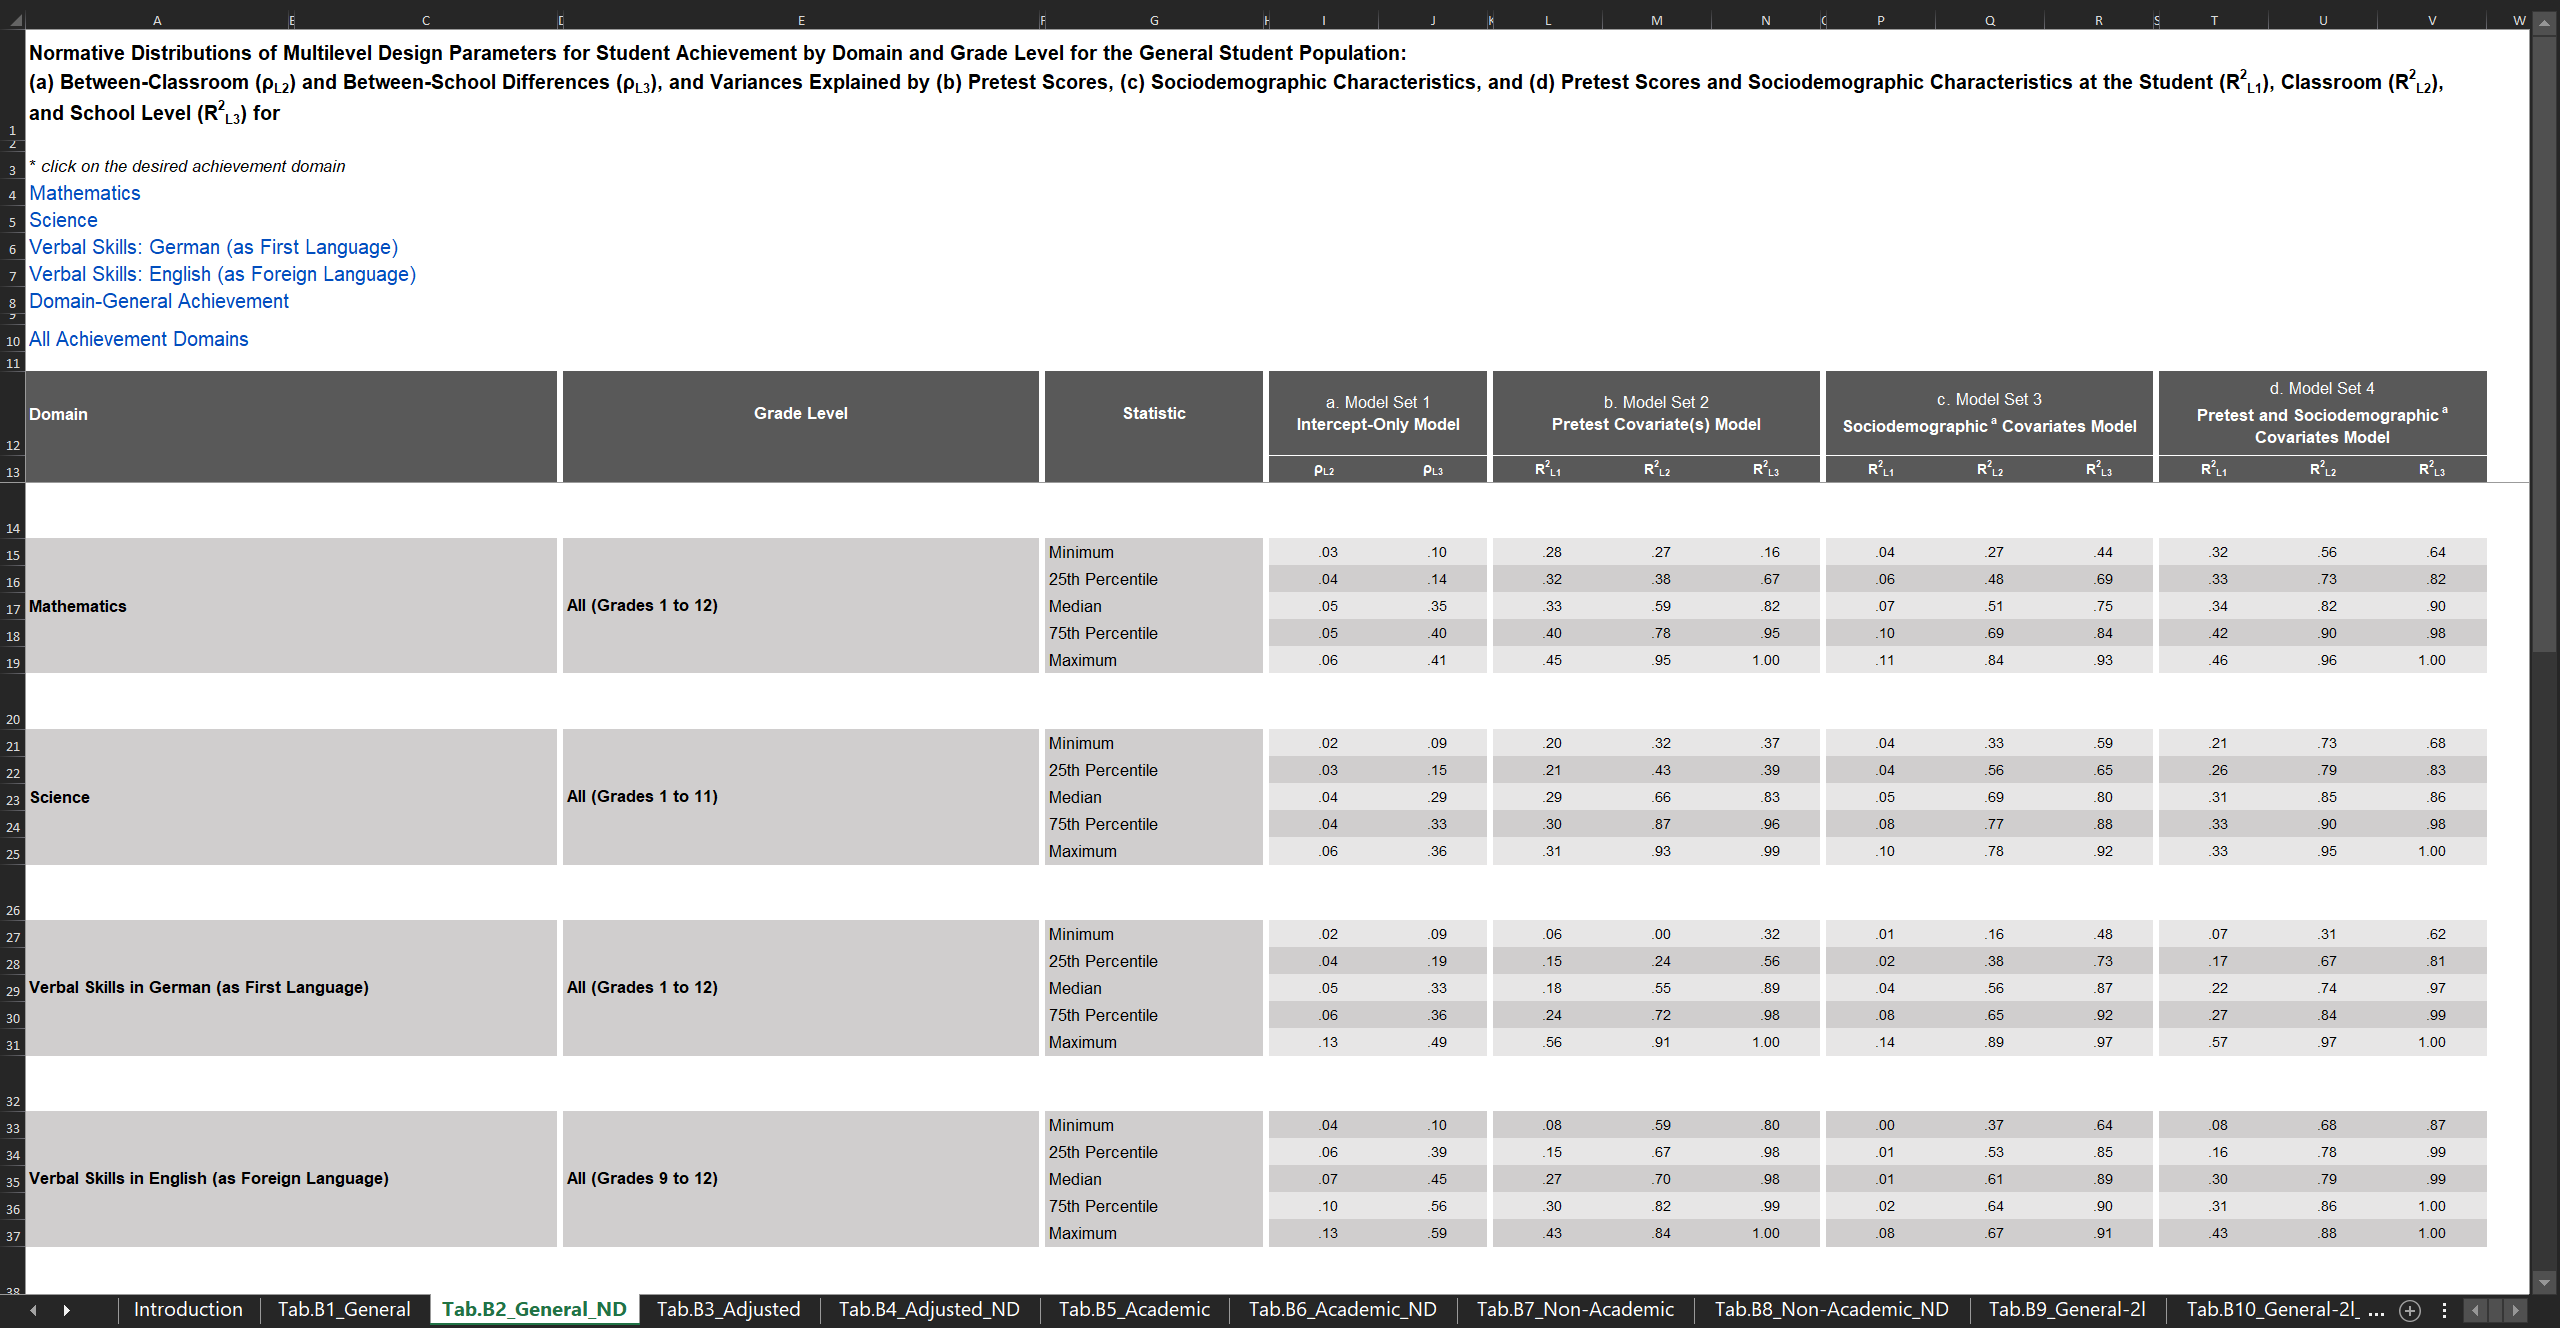
Our comprehensive set of multilevel design parameters for student achievement in elementary and secondary school
In Stallasch et al. (2021), we generated ρ and R2 values with corresponding standard errors for student achievement as the intervention’s target outcome. We specified two-level (students within schools) and three-level (students within classrooms within schools) latent covariate models to analyze design parameters for a broad array of mathematical-scientific, verbal, and domain-general achievement outcomes. The estimates apply to several (sub)populations across the entire school career from Grade 1 to 12. We cover the three most important covariate sets: pretests, sociodemographic characteristics, and the combination thereof. We utilized data from five national probability samples of three longitudinal German large-scale assessments (DESI, NEPS, PISA-I+ 2003), and additionally summarized the estimates in terms of normative distributions.
The design parameters are presented in an interactive Excel file. This Supplemental Online Material B comes with a detailed introduction on the application scopes for the various sets of estimates. The document can be downloaded from the study’s OSF repo or the Journal’s website.
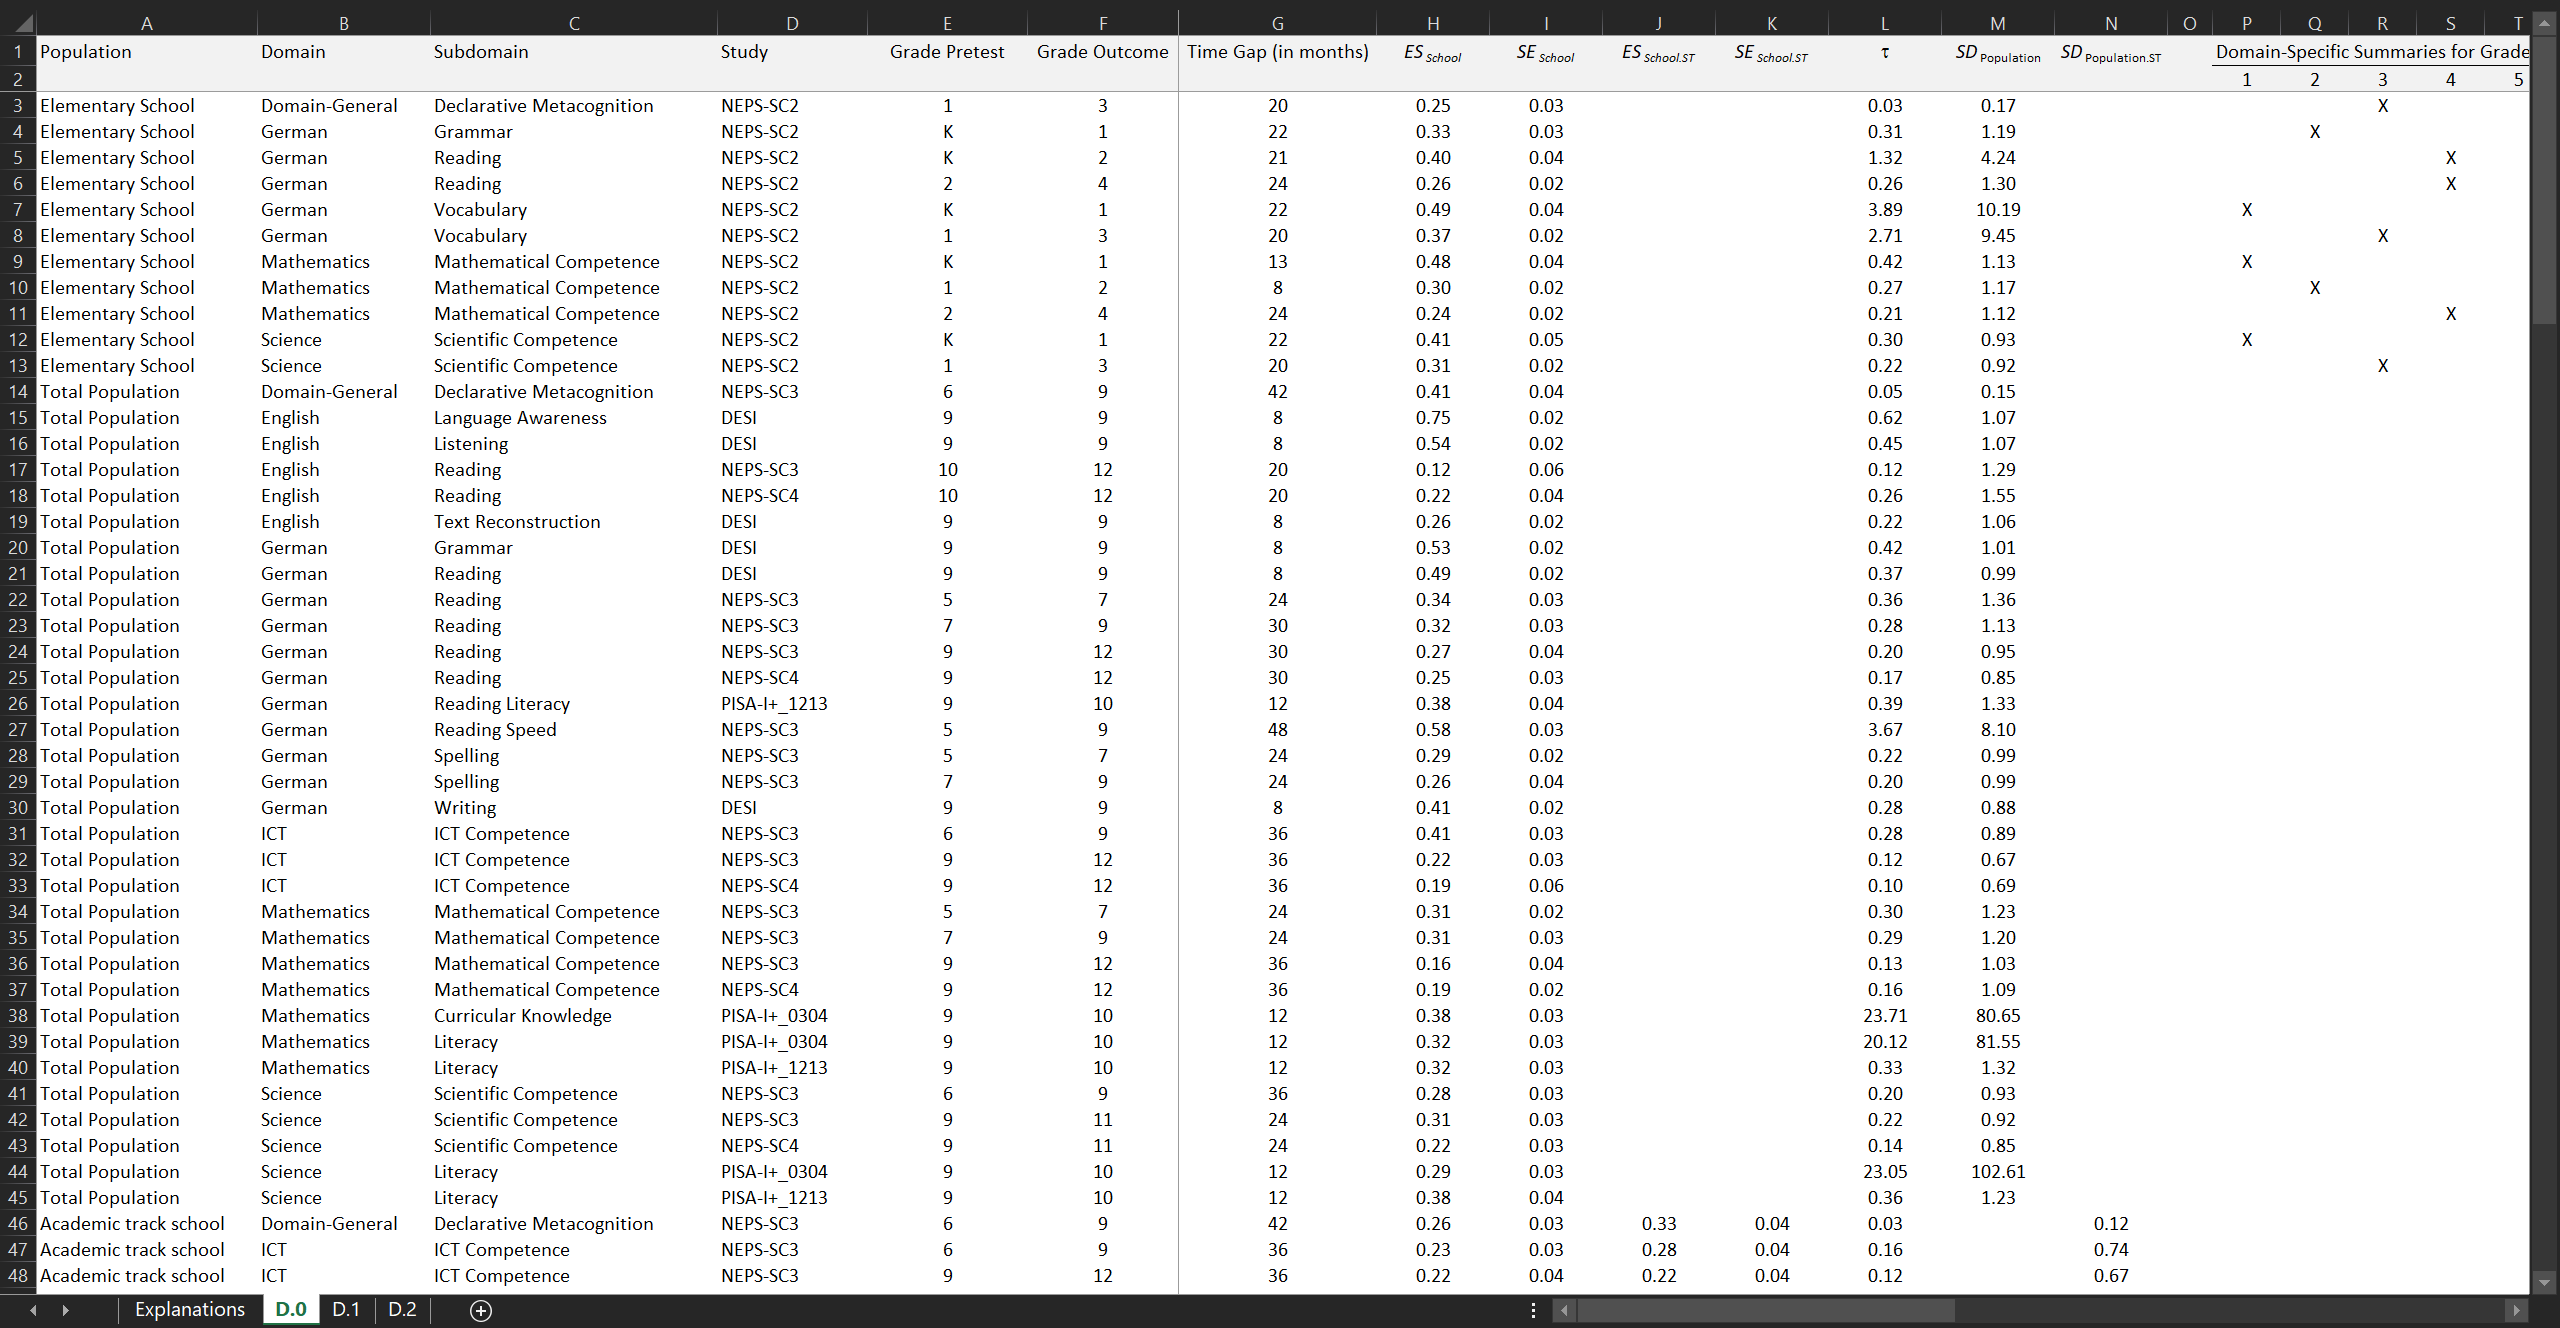
Stallasch et al. (2024)
Our (meta-analytic) single- and multilevel design parameters and selection guidelines for various covariate types, combinations, and time lags
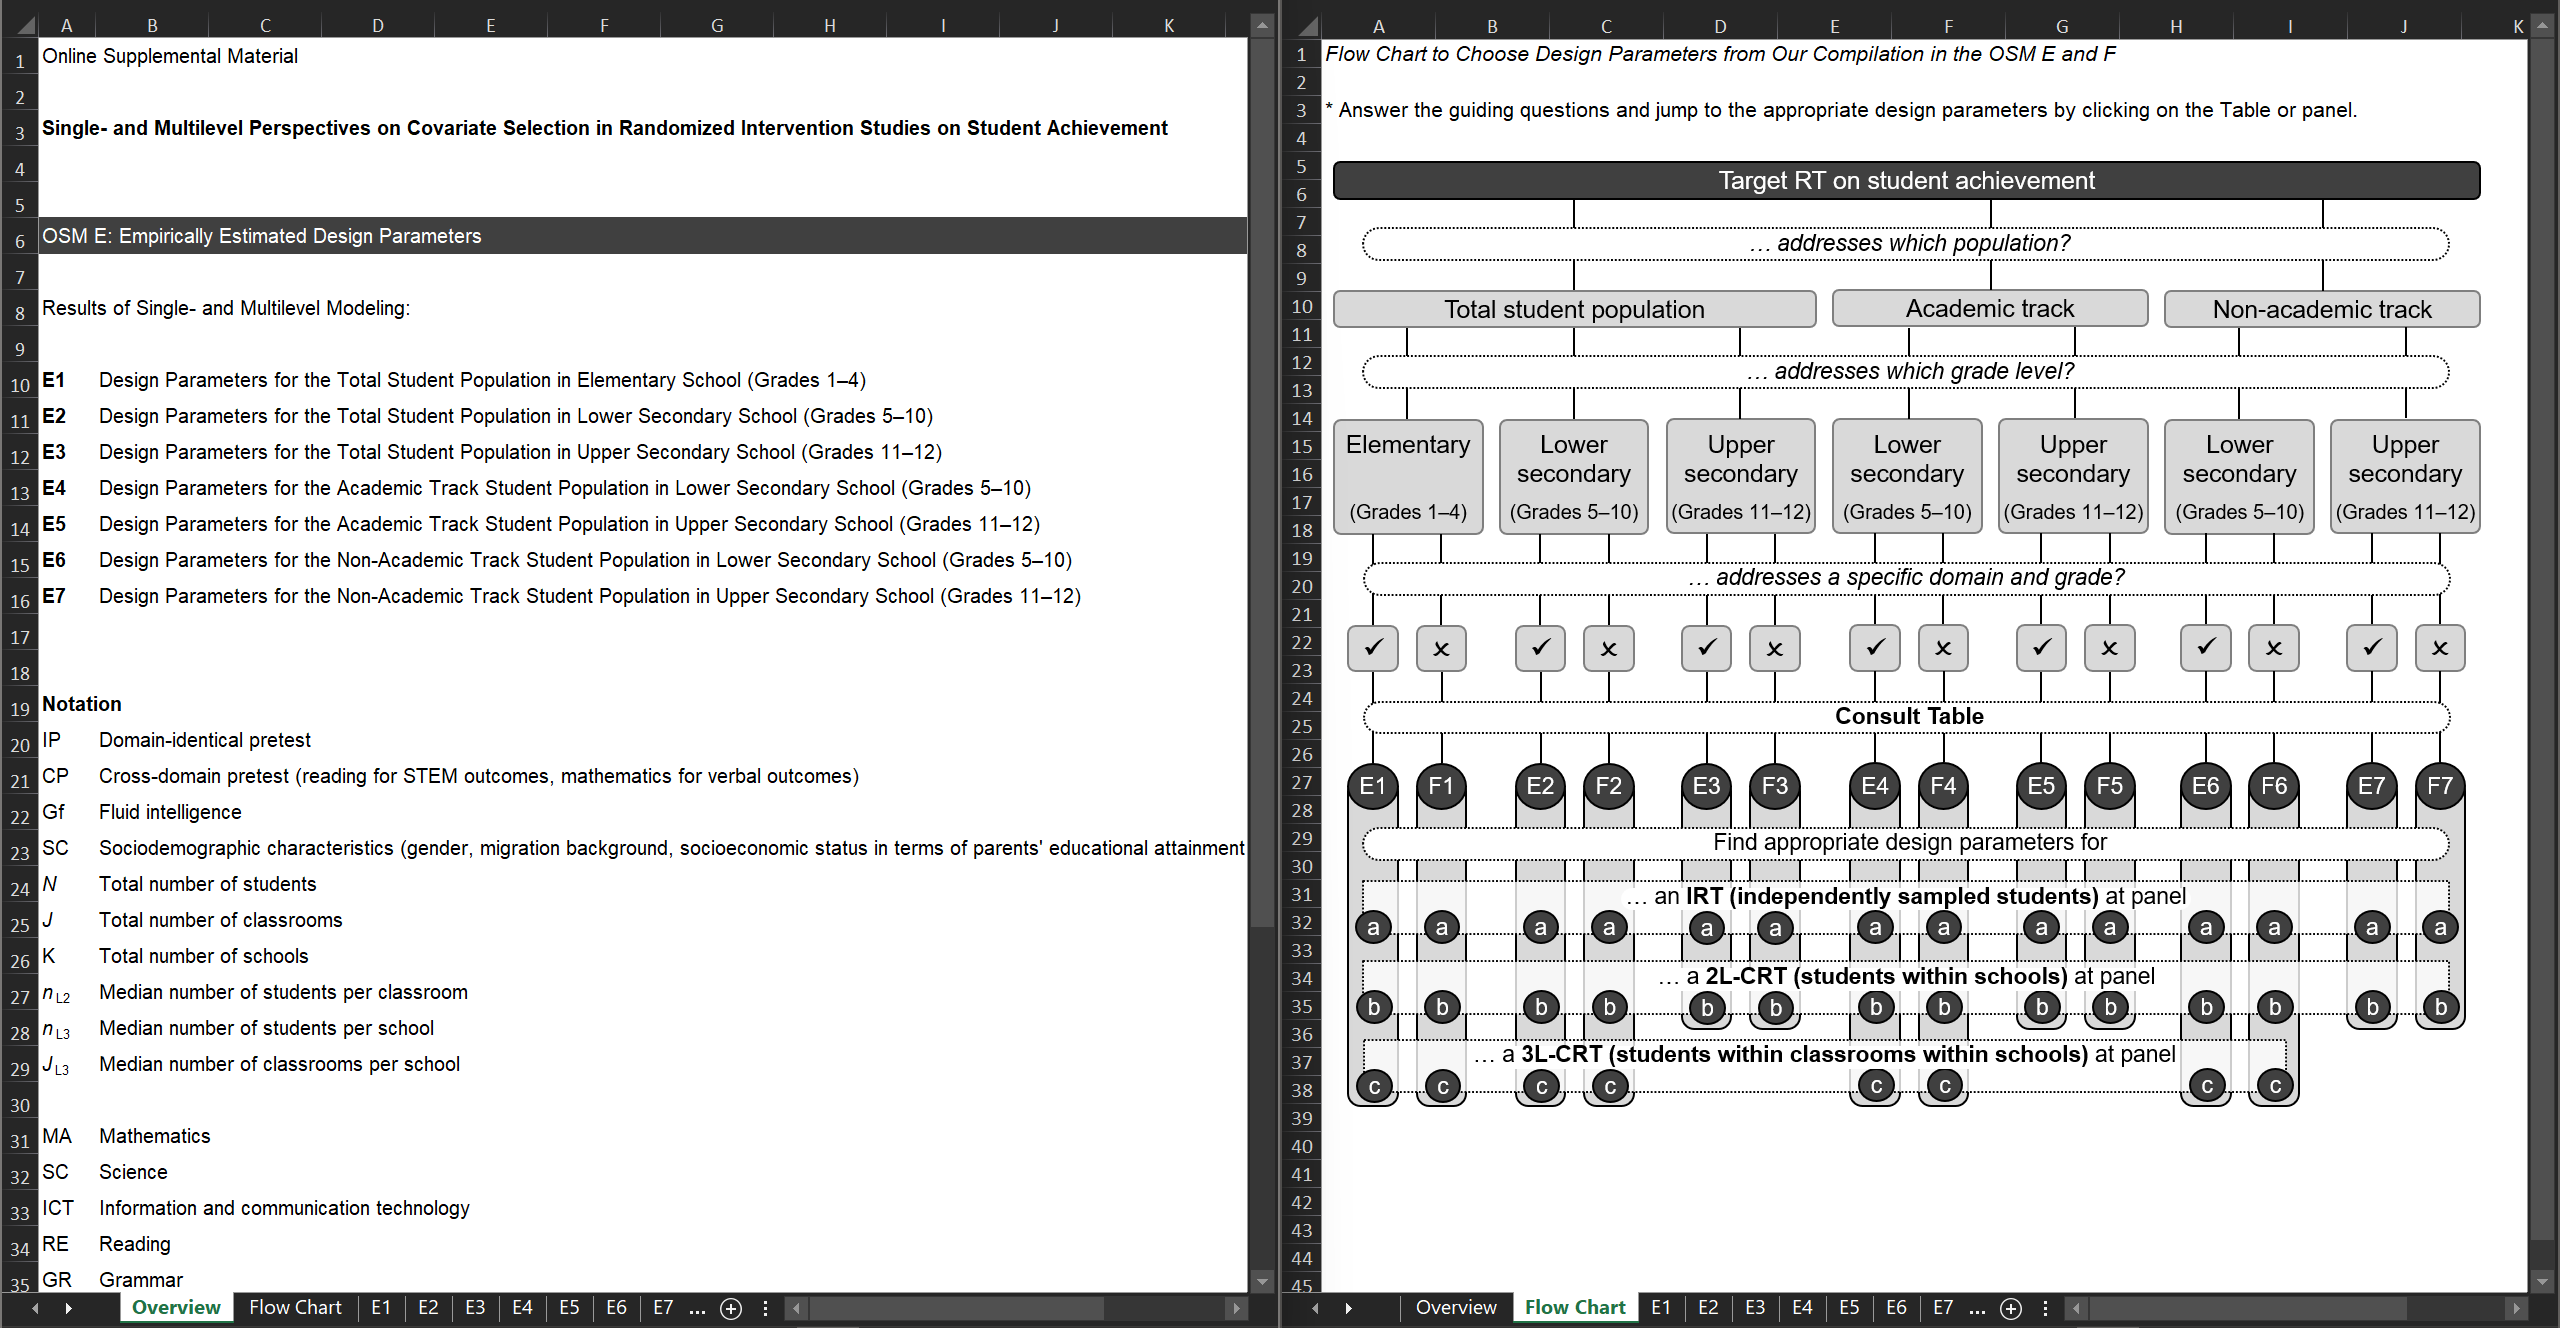
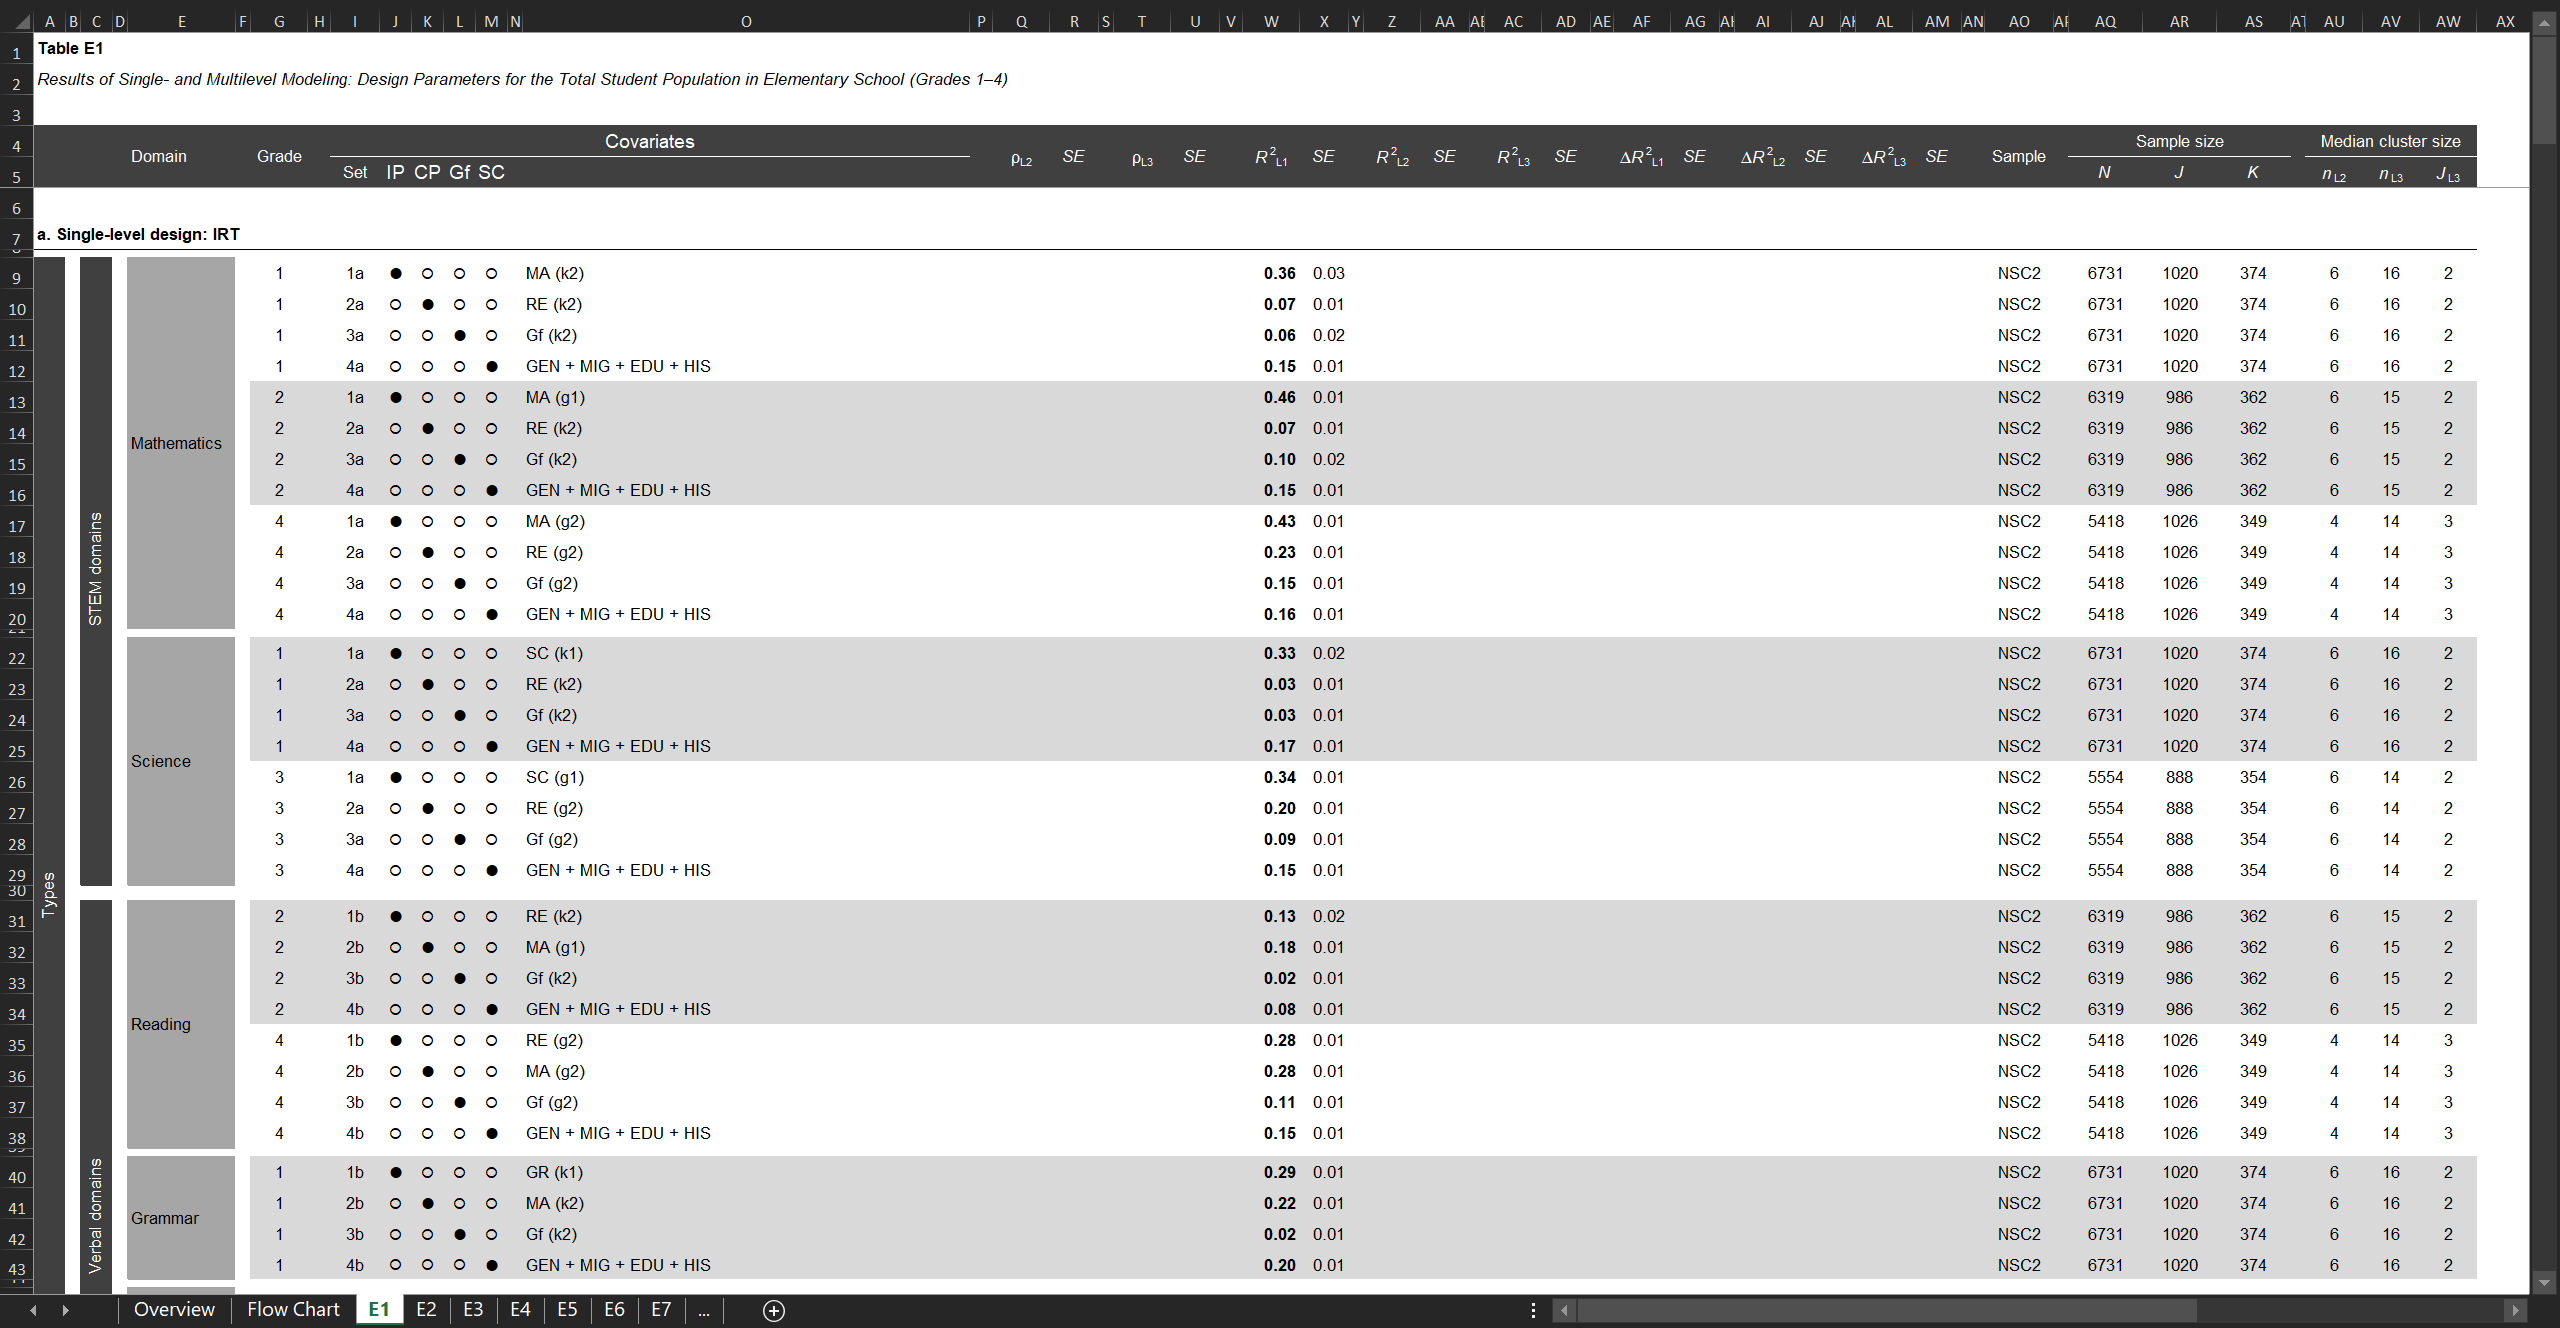
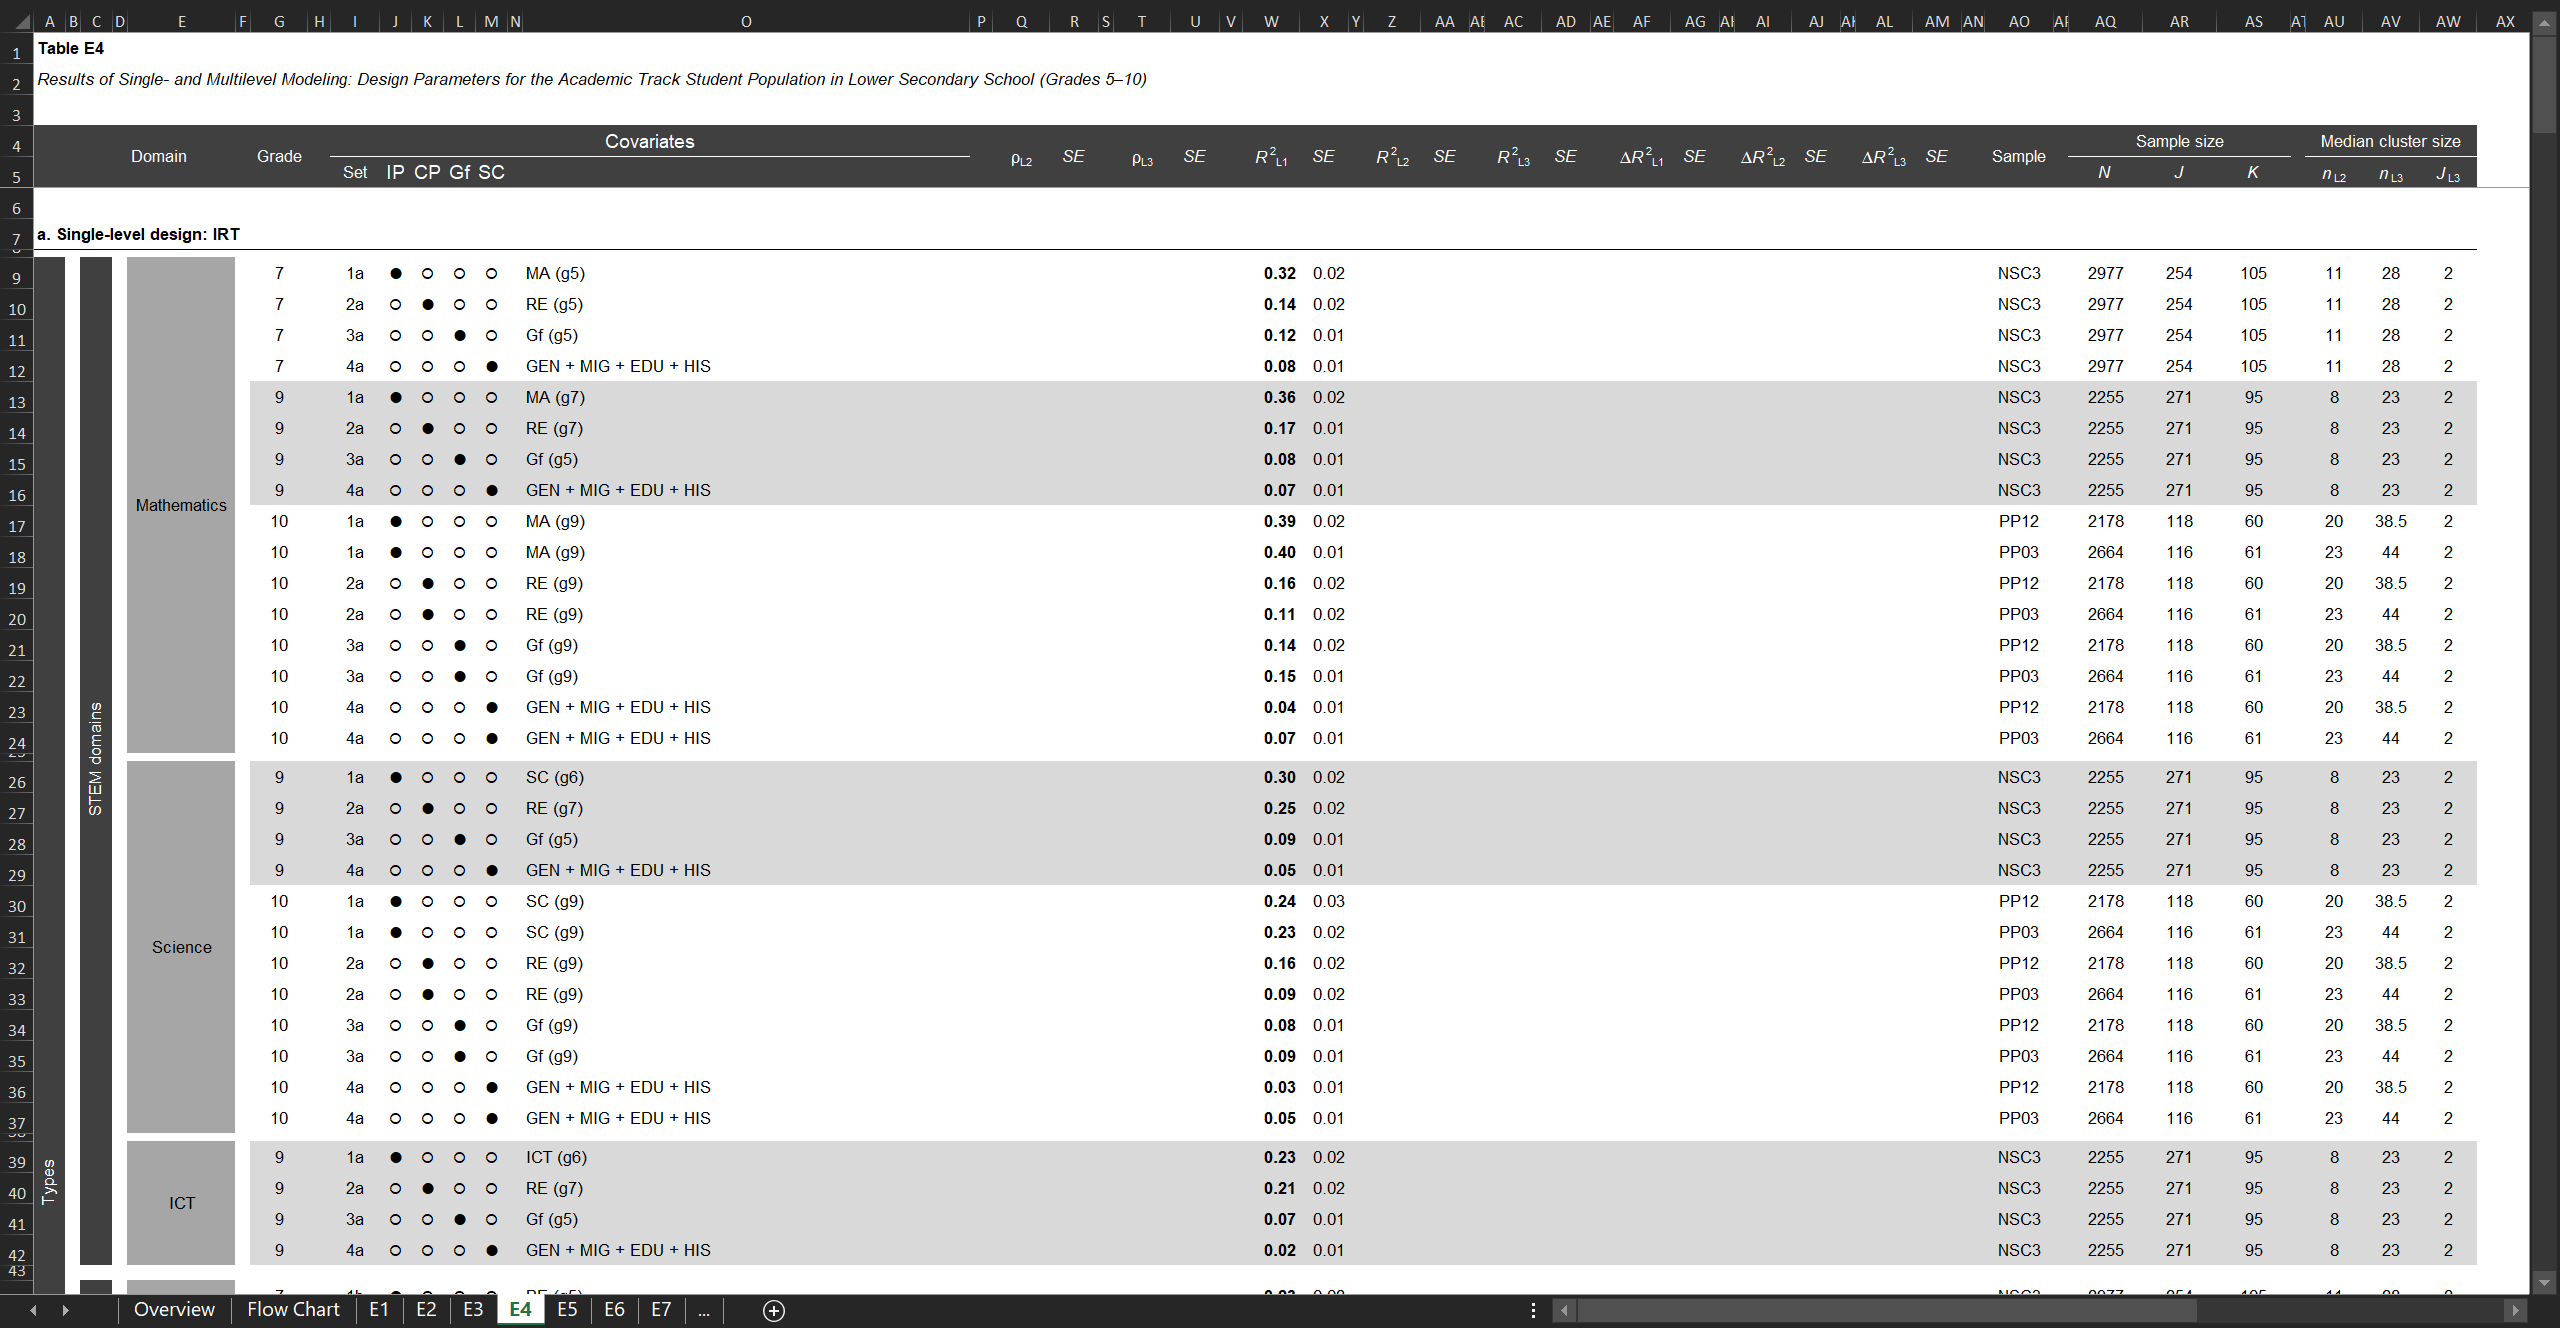
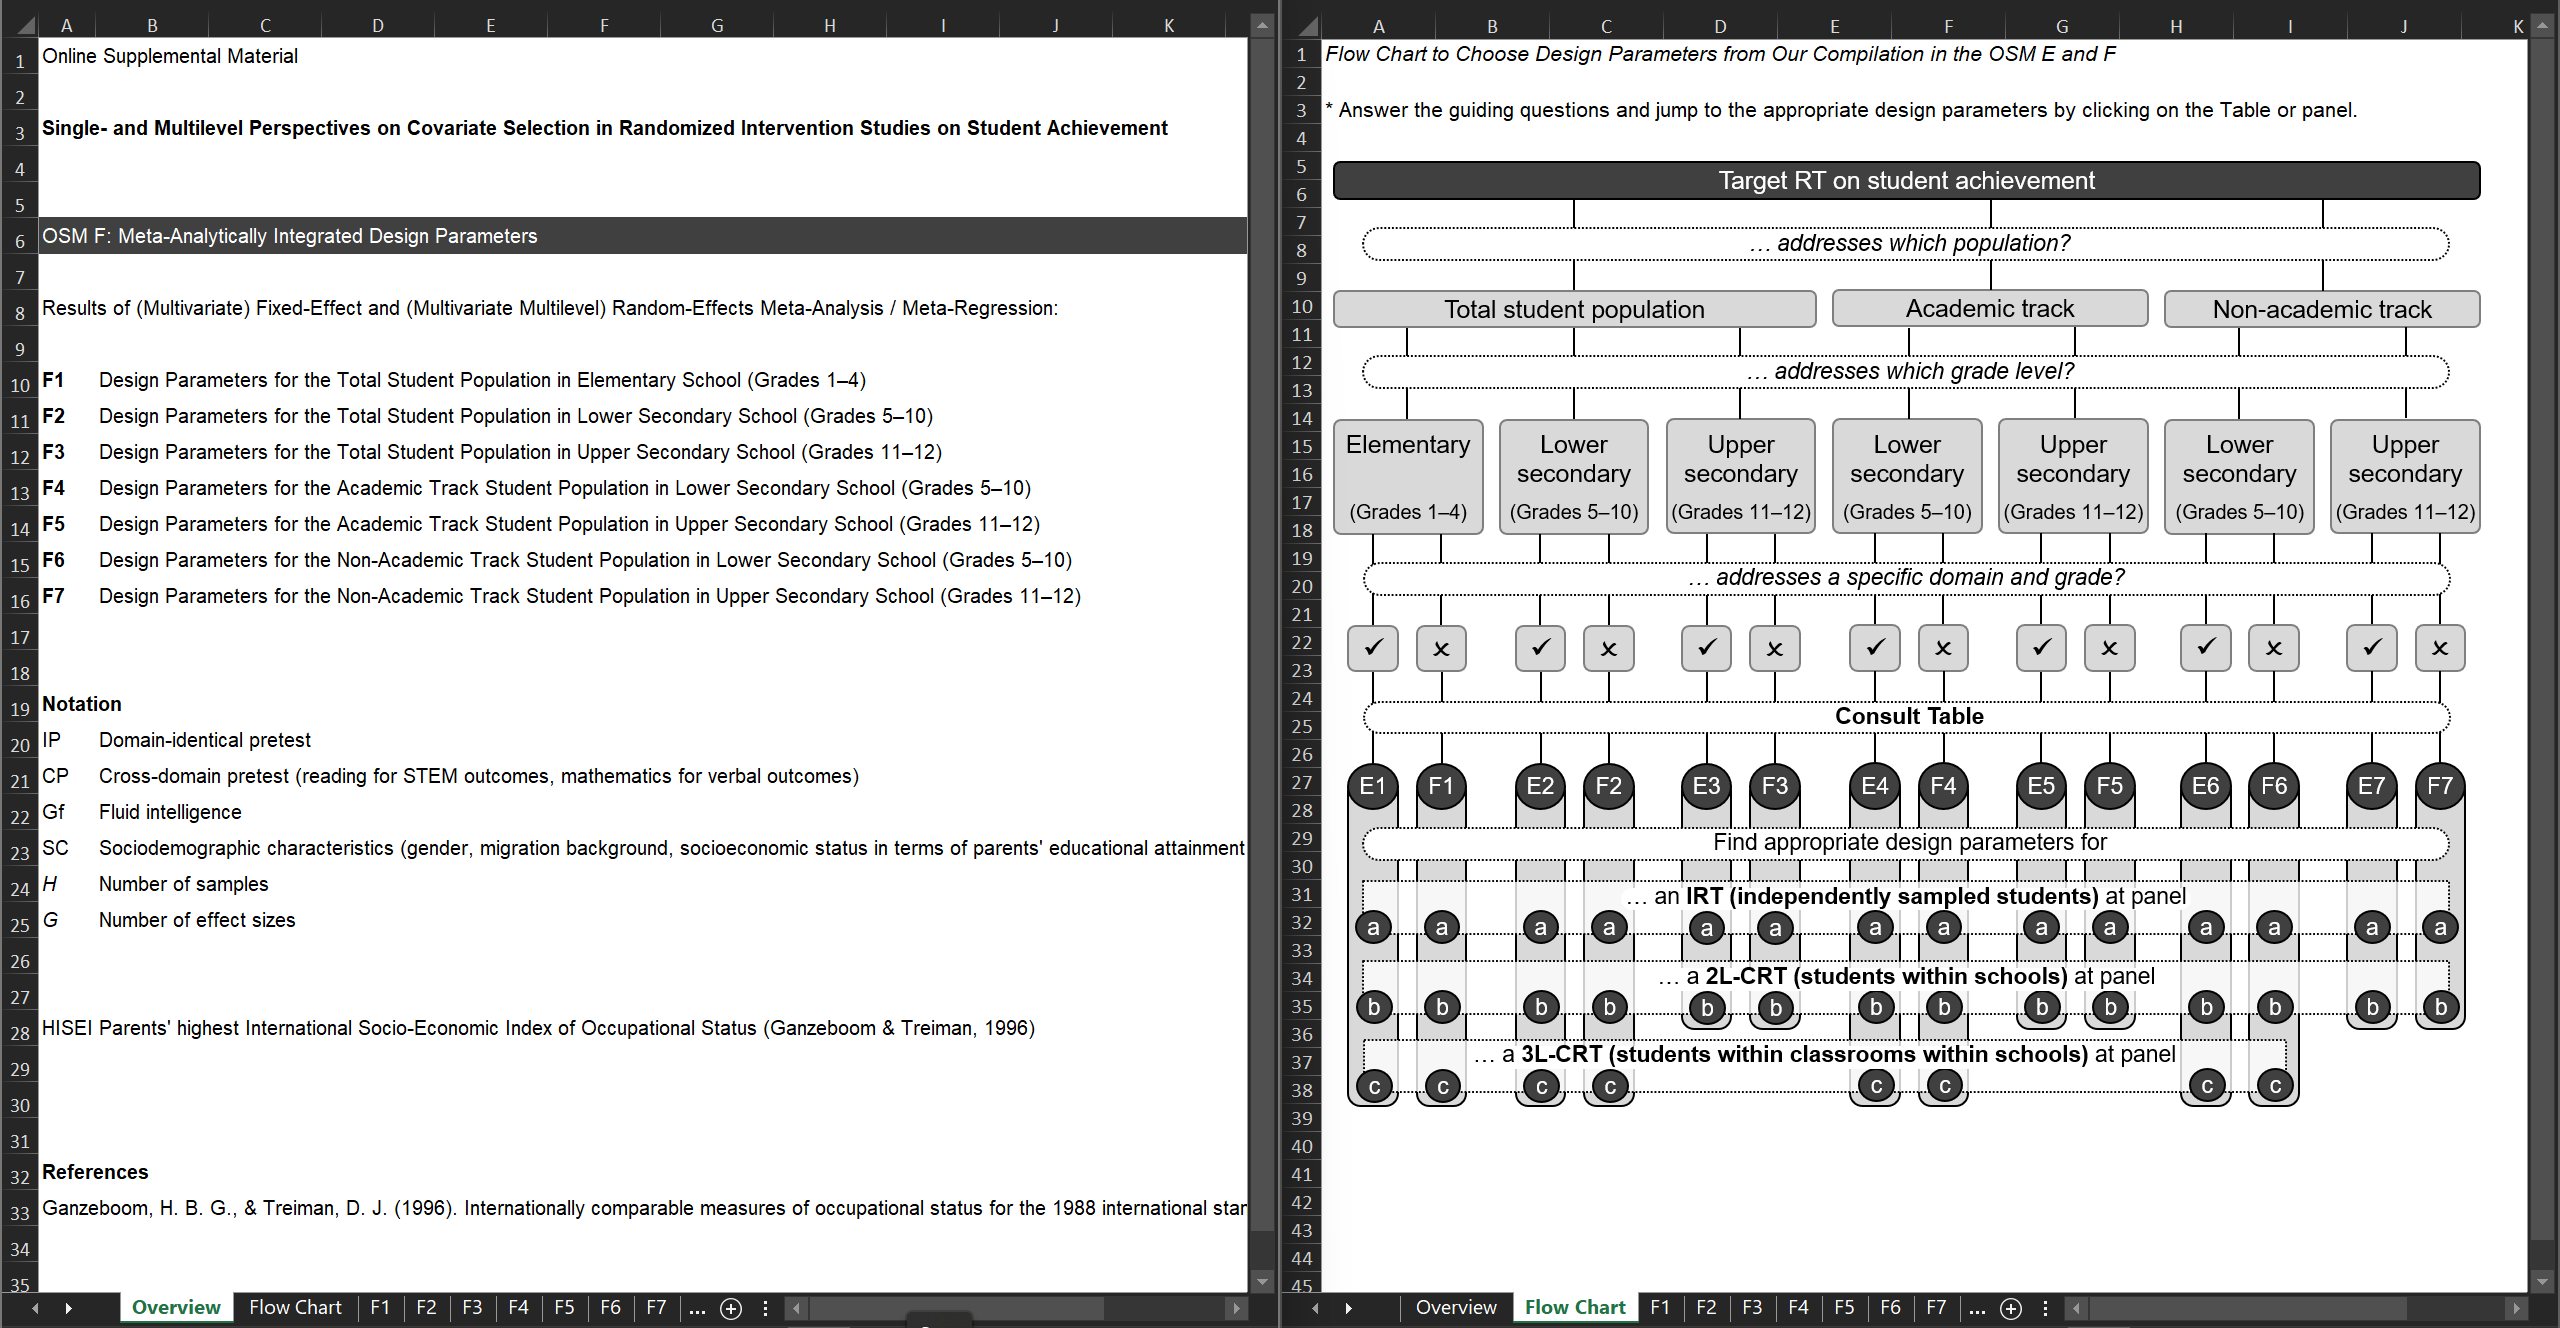
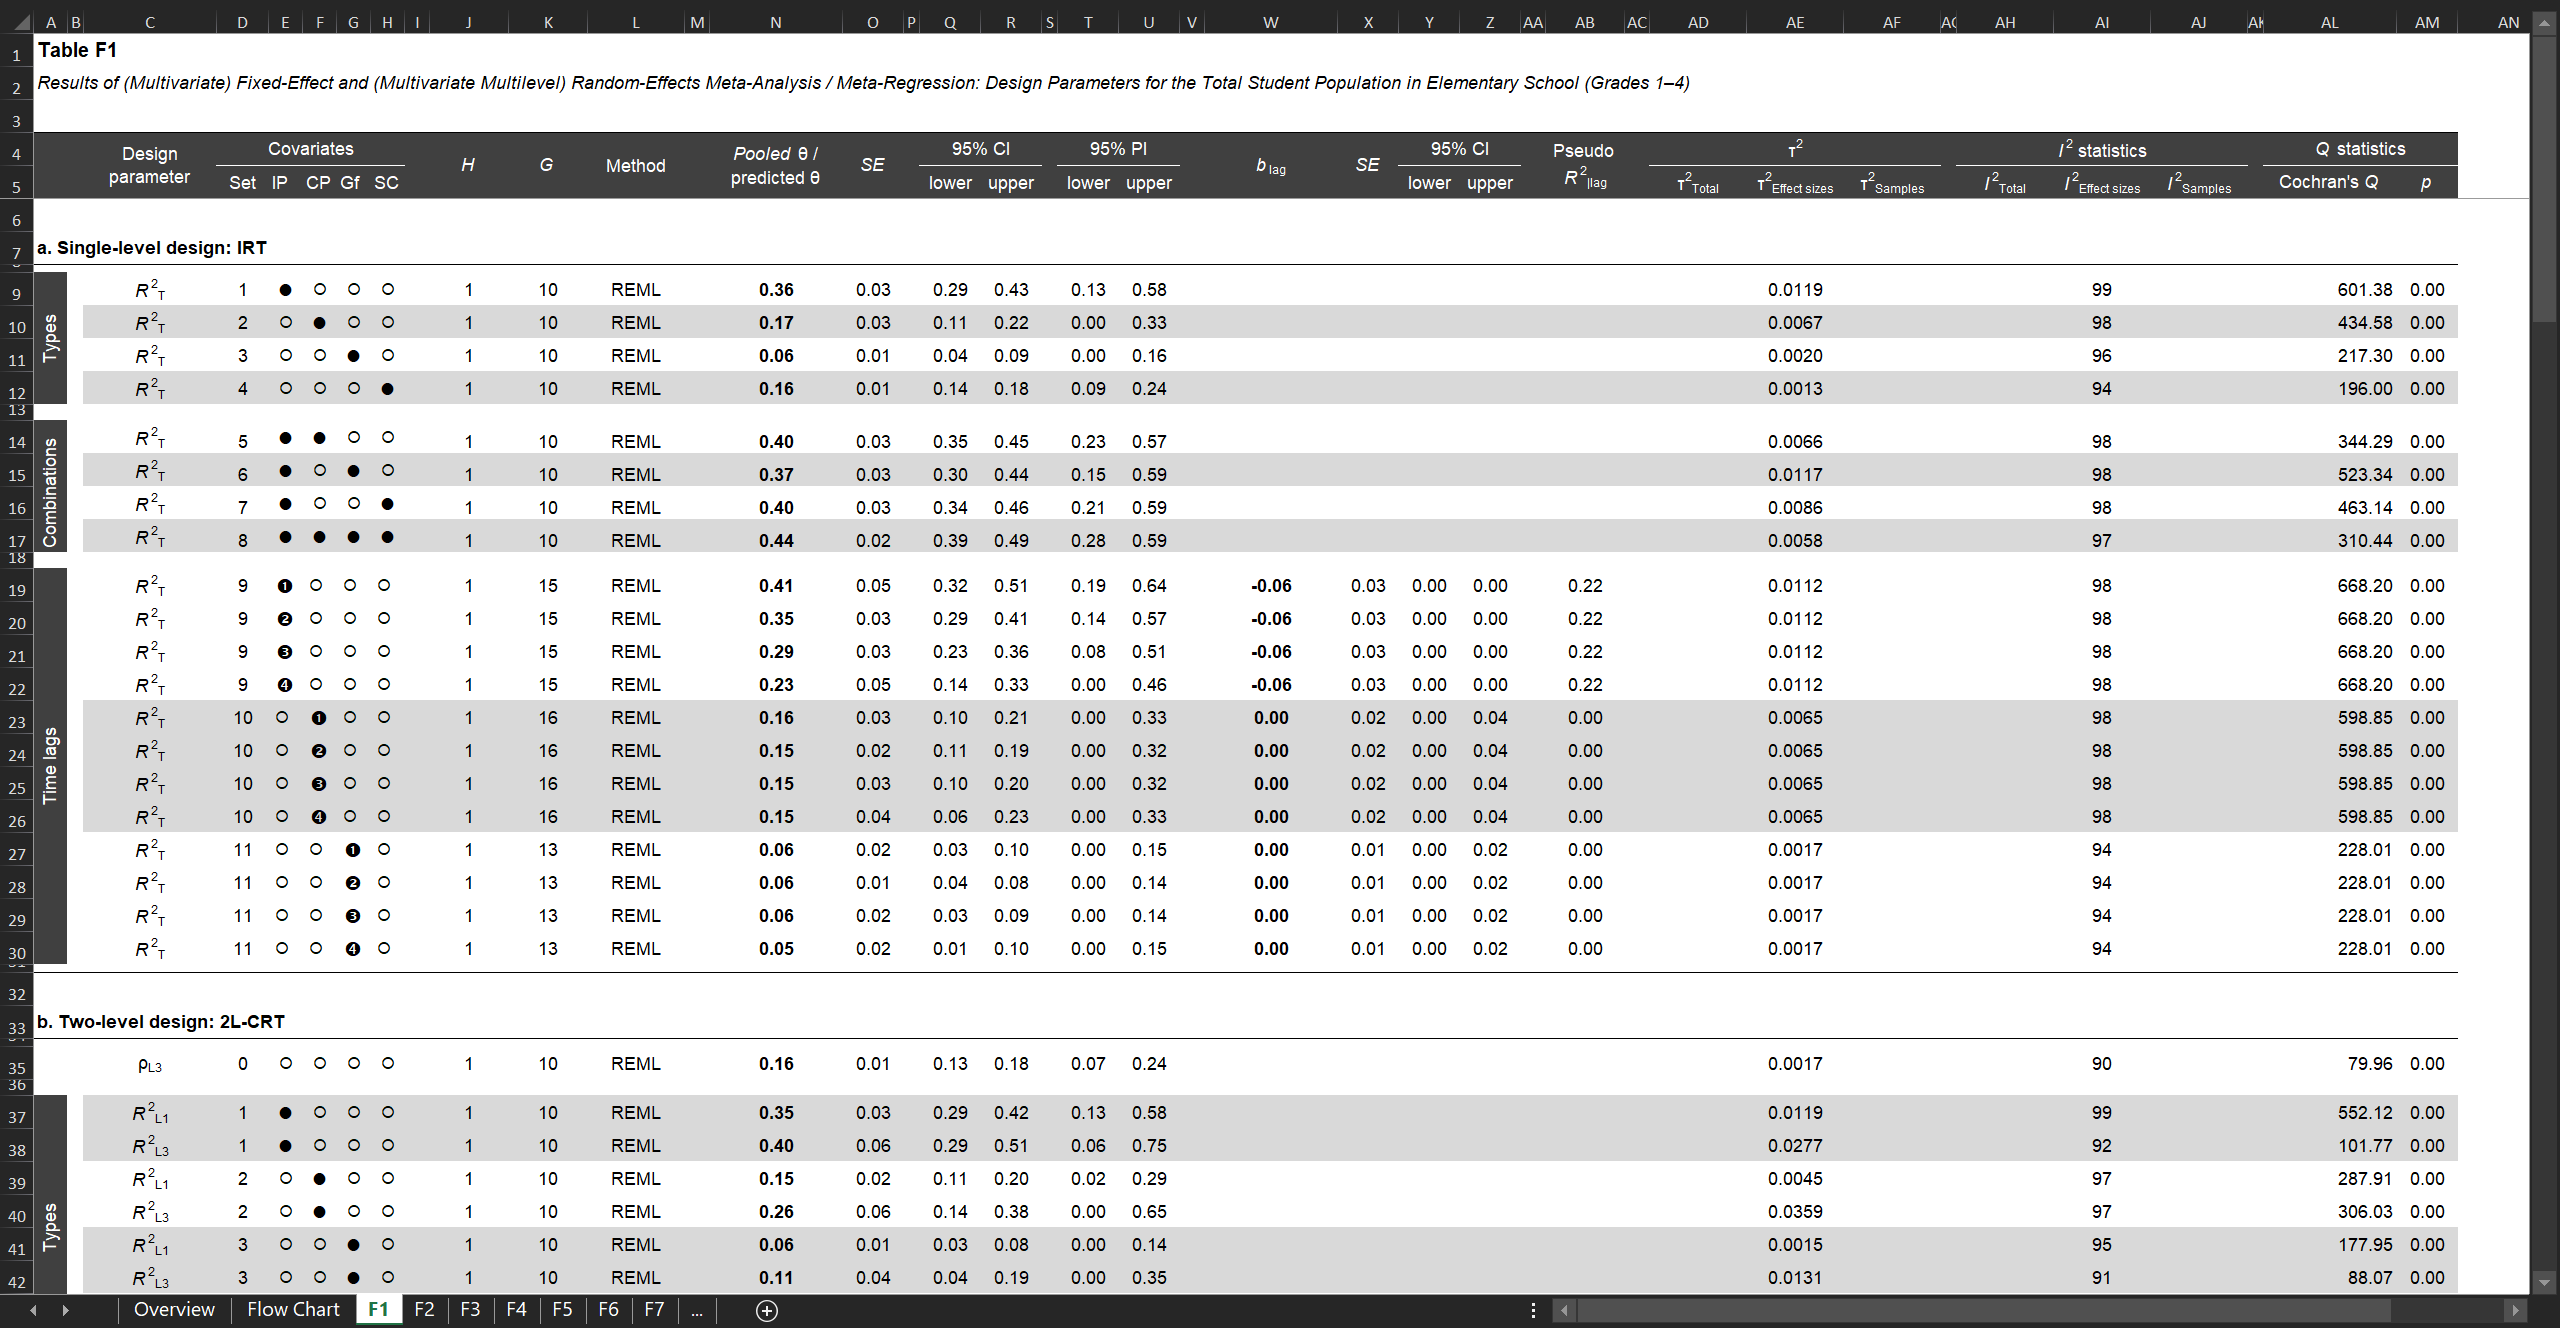
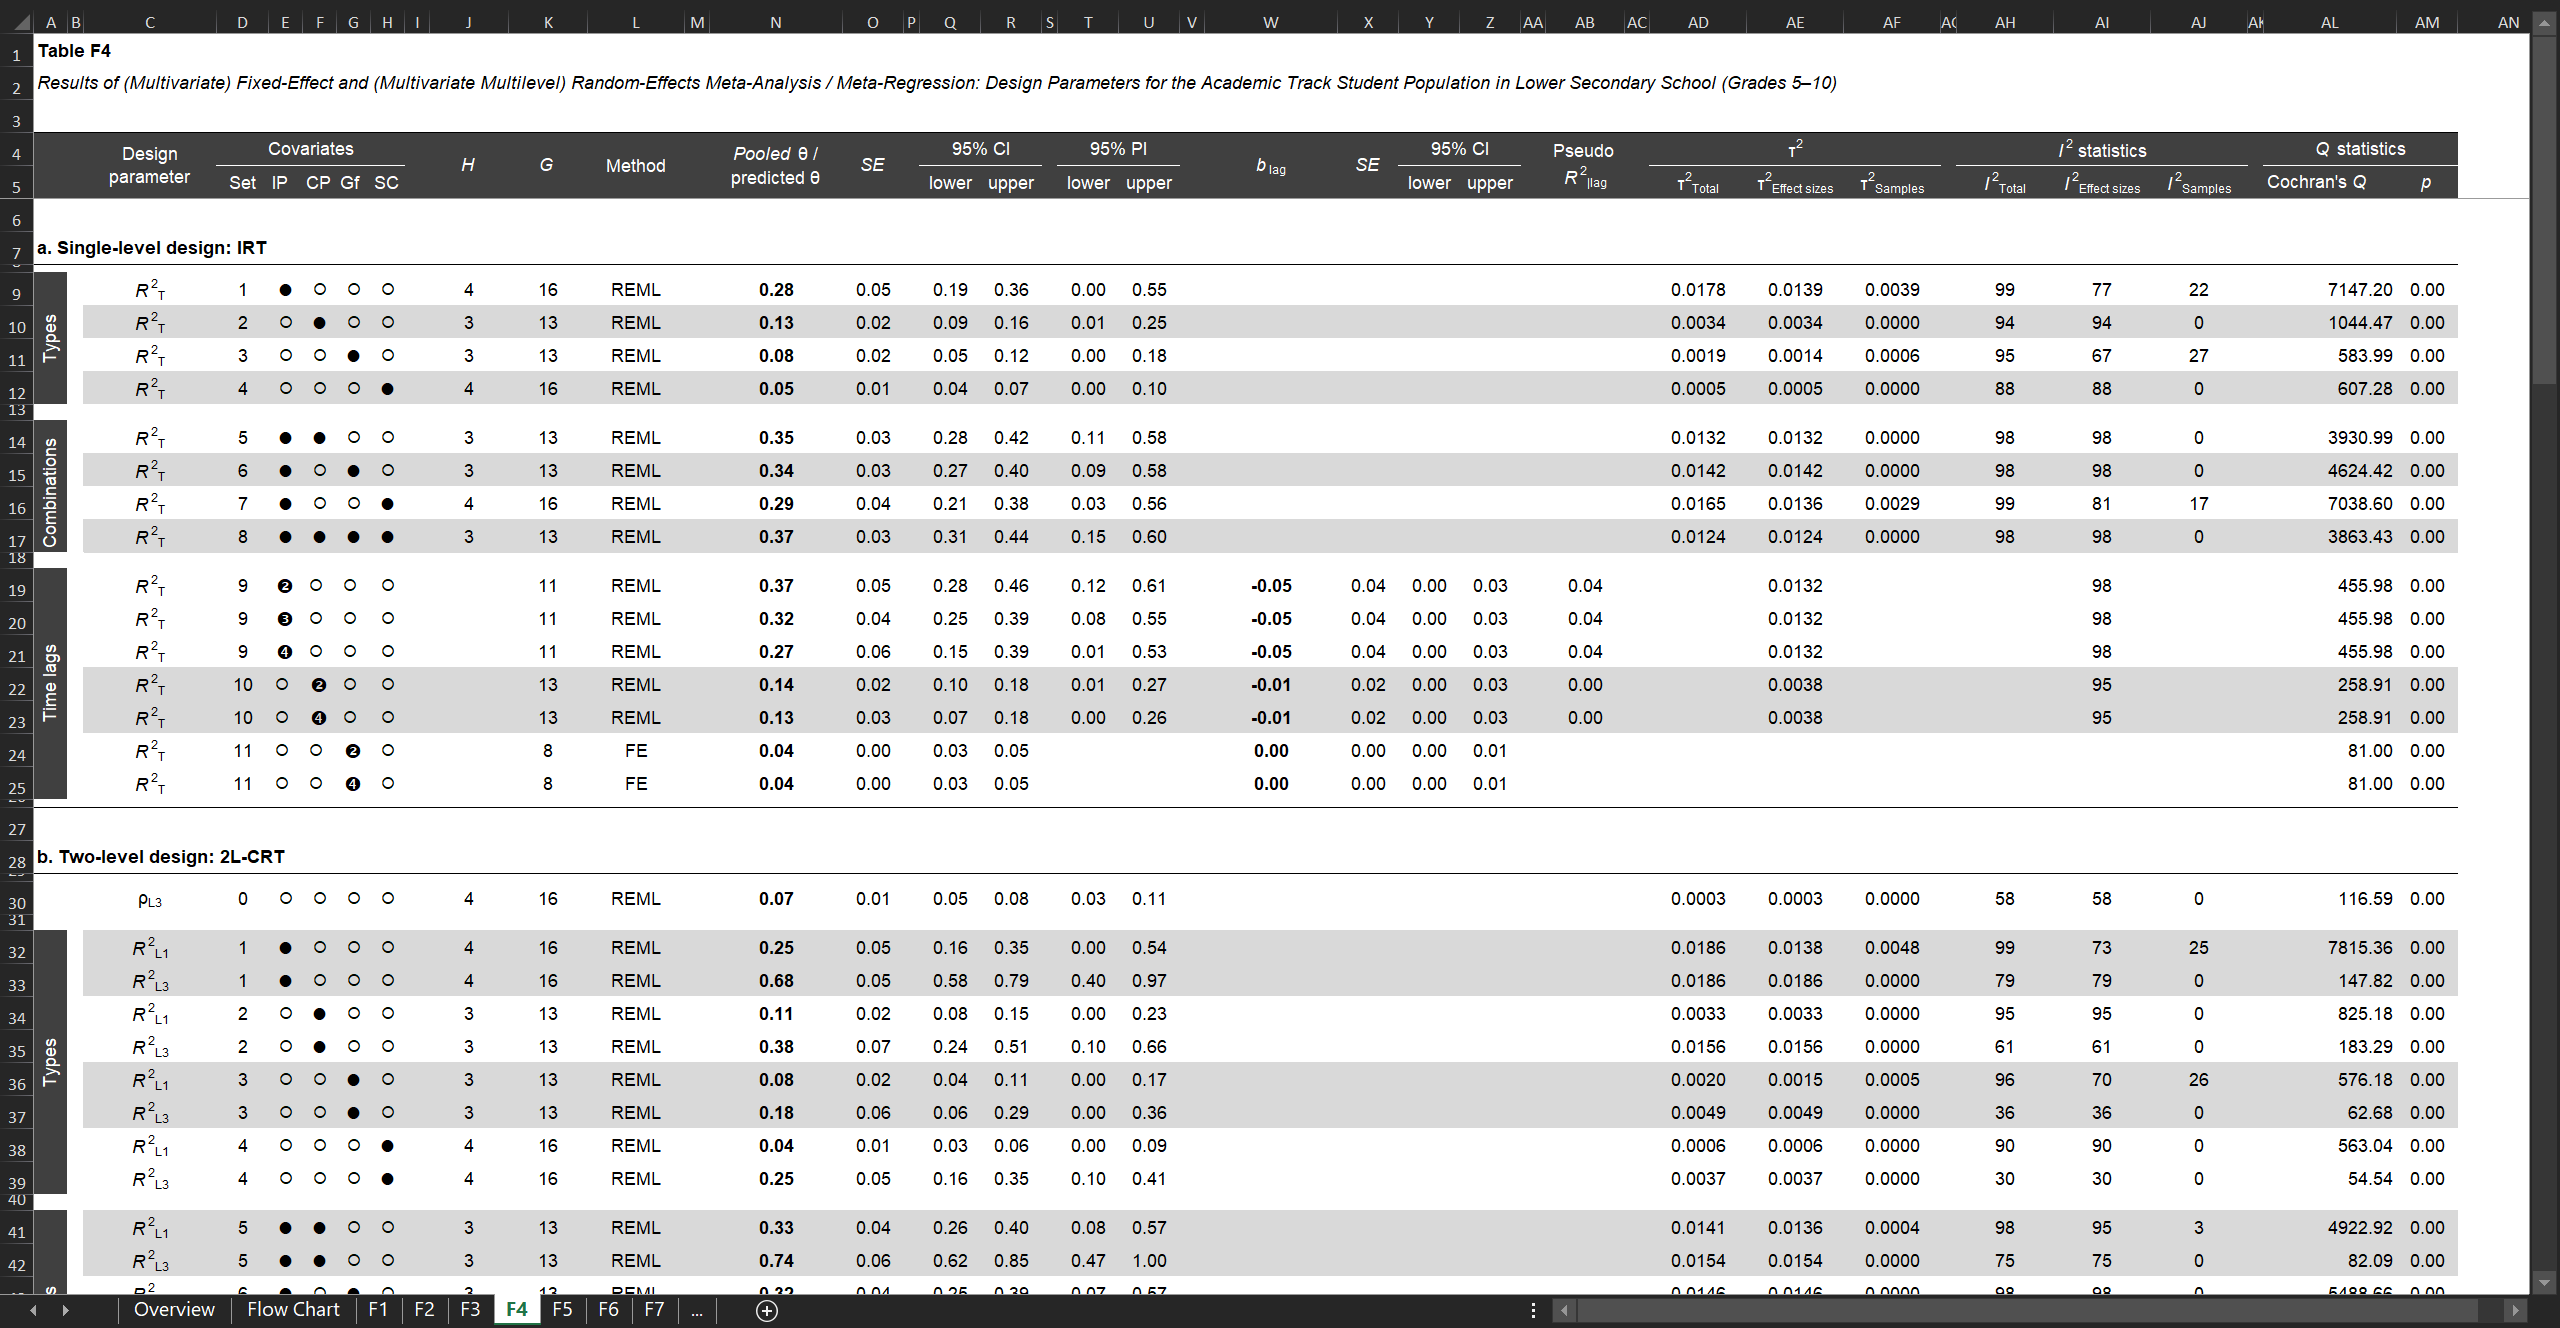
In Stallasch et al. (2024), we specifically focused on covariates in randomized trials on student achievement. We accumulated a vast collection of R2 values with corresponding standard errors. Specifically, we referred to influential psychometric heuristics to analyze design parameters and develop selection guidelines for covariate types of varying bandwidth-fidelity, covariate combinations to quantify their incremental validities, and covariate time lags of 1 to 7 years to examine their validity degradation. We applied (manifest) single-level (students assumed to be independent), two-level (students within schools), and three-level (students within classrooms within schools) modeling and considered various mathematical-scientific and verbal achievement outcomes. Data stemmed from six national probability samples of three longitudinal German large-scale assessments (DESI, NEPS, PISA-I+ 2003, PISA-I+ 2012). The empirically estimated design parameters were meta-analytically integrated and employed in precision simulations.
The design parameters (and simulation results) are listed in interactive Excel files. The empirical estimates can be found in Online Supplemental Material E, and the meta-analytic estimates in Online Supplemental Material F (and the simulation results in Online Supplemental Material G). These resources can be downloaded from the study’s OSF repo.
Brunner et al. (2024)
Our (meta-analytic) design parameters for cognitive and socio-emotional learning outcomes in preschool
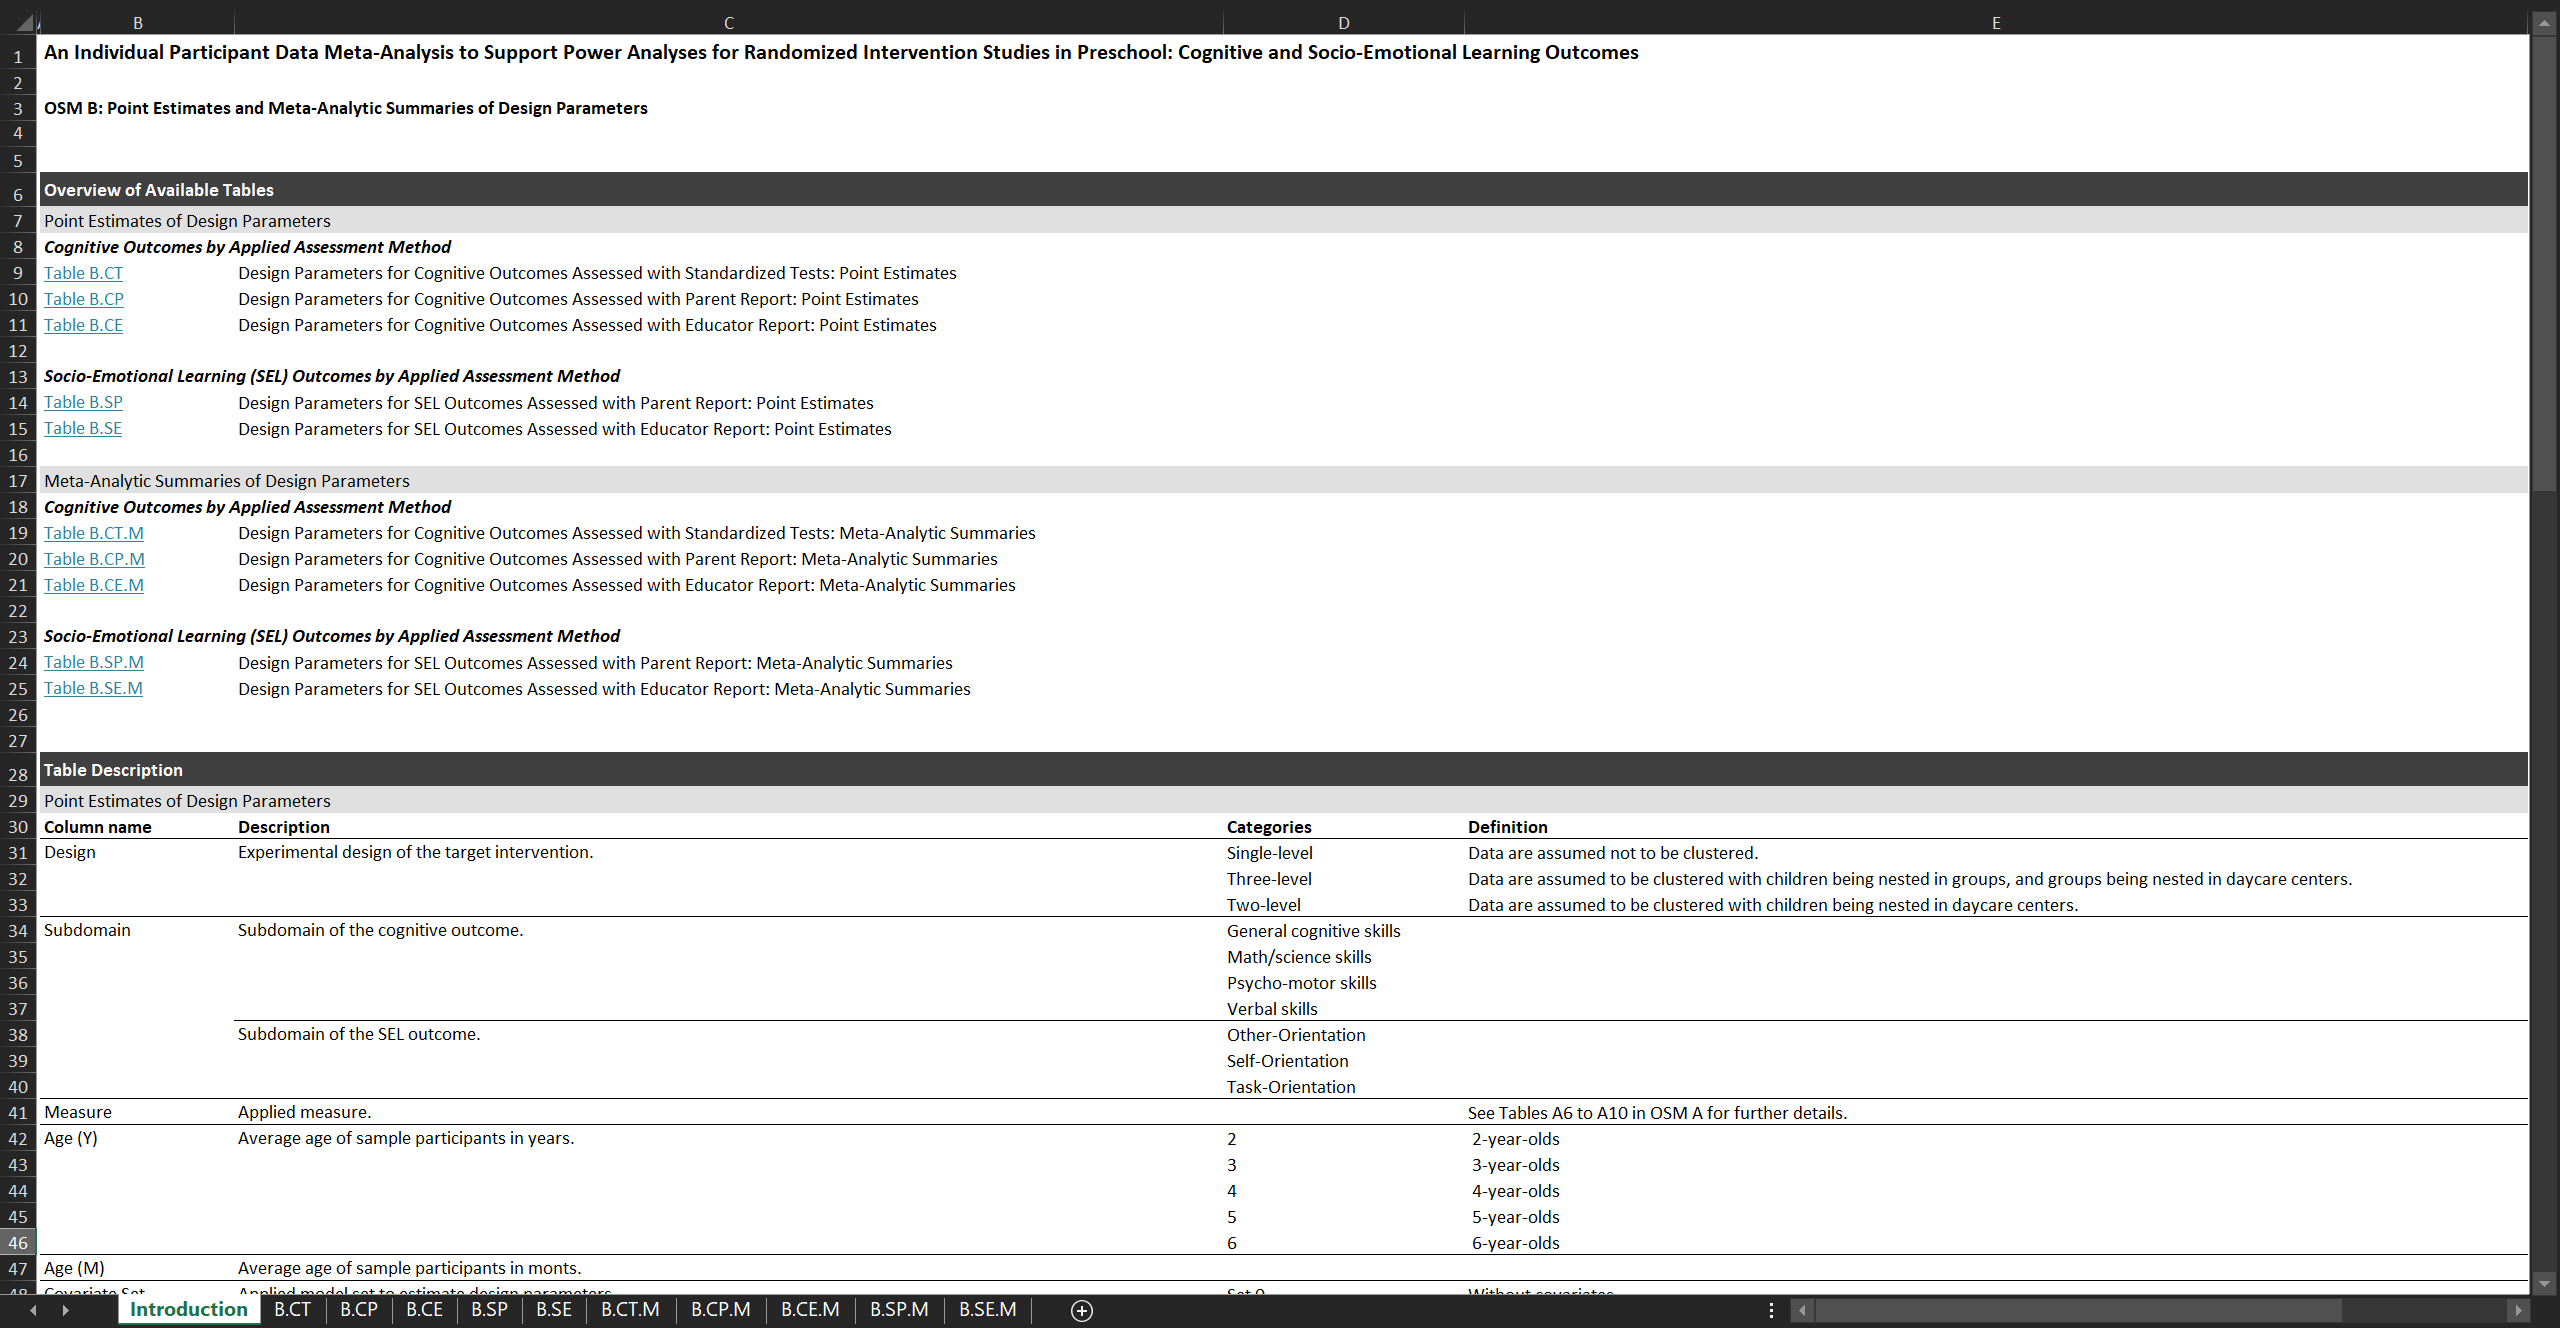
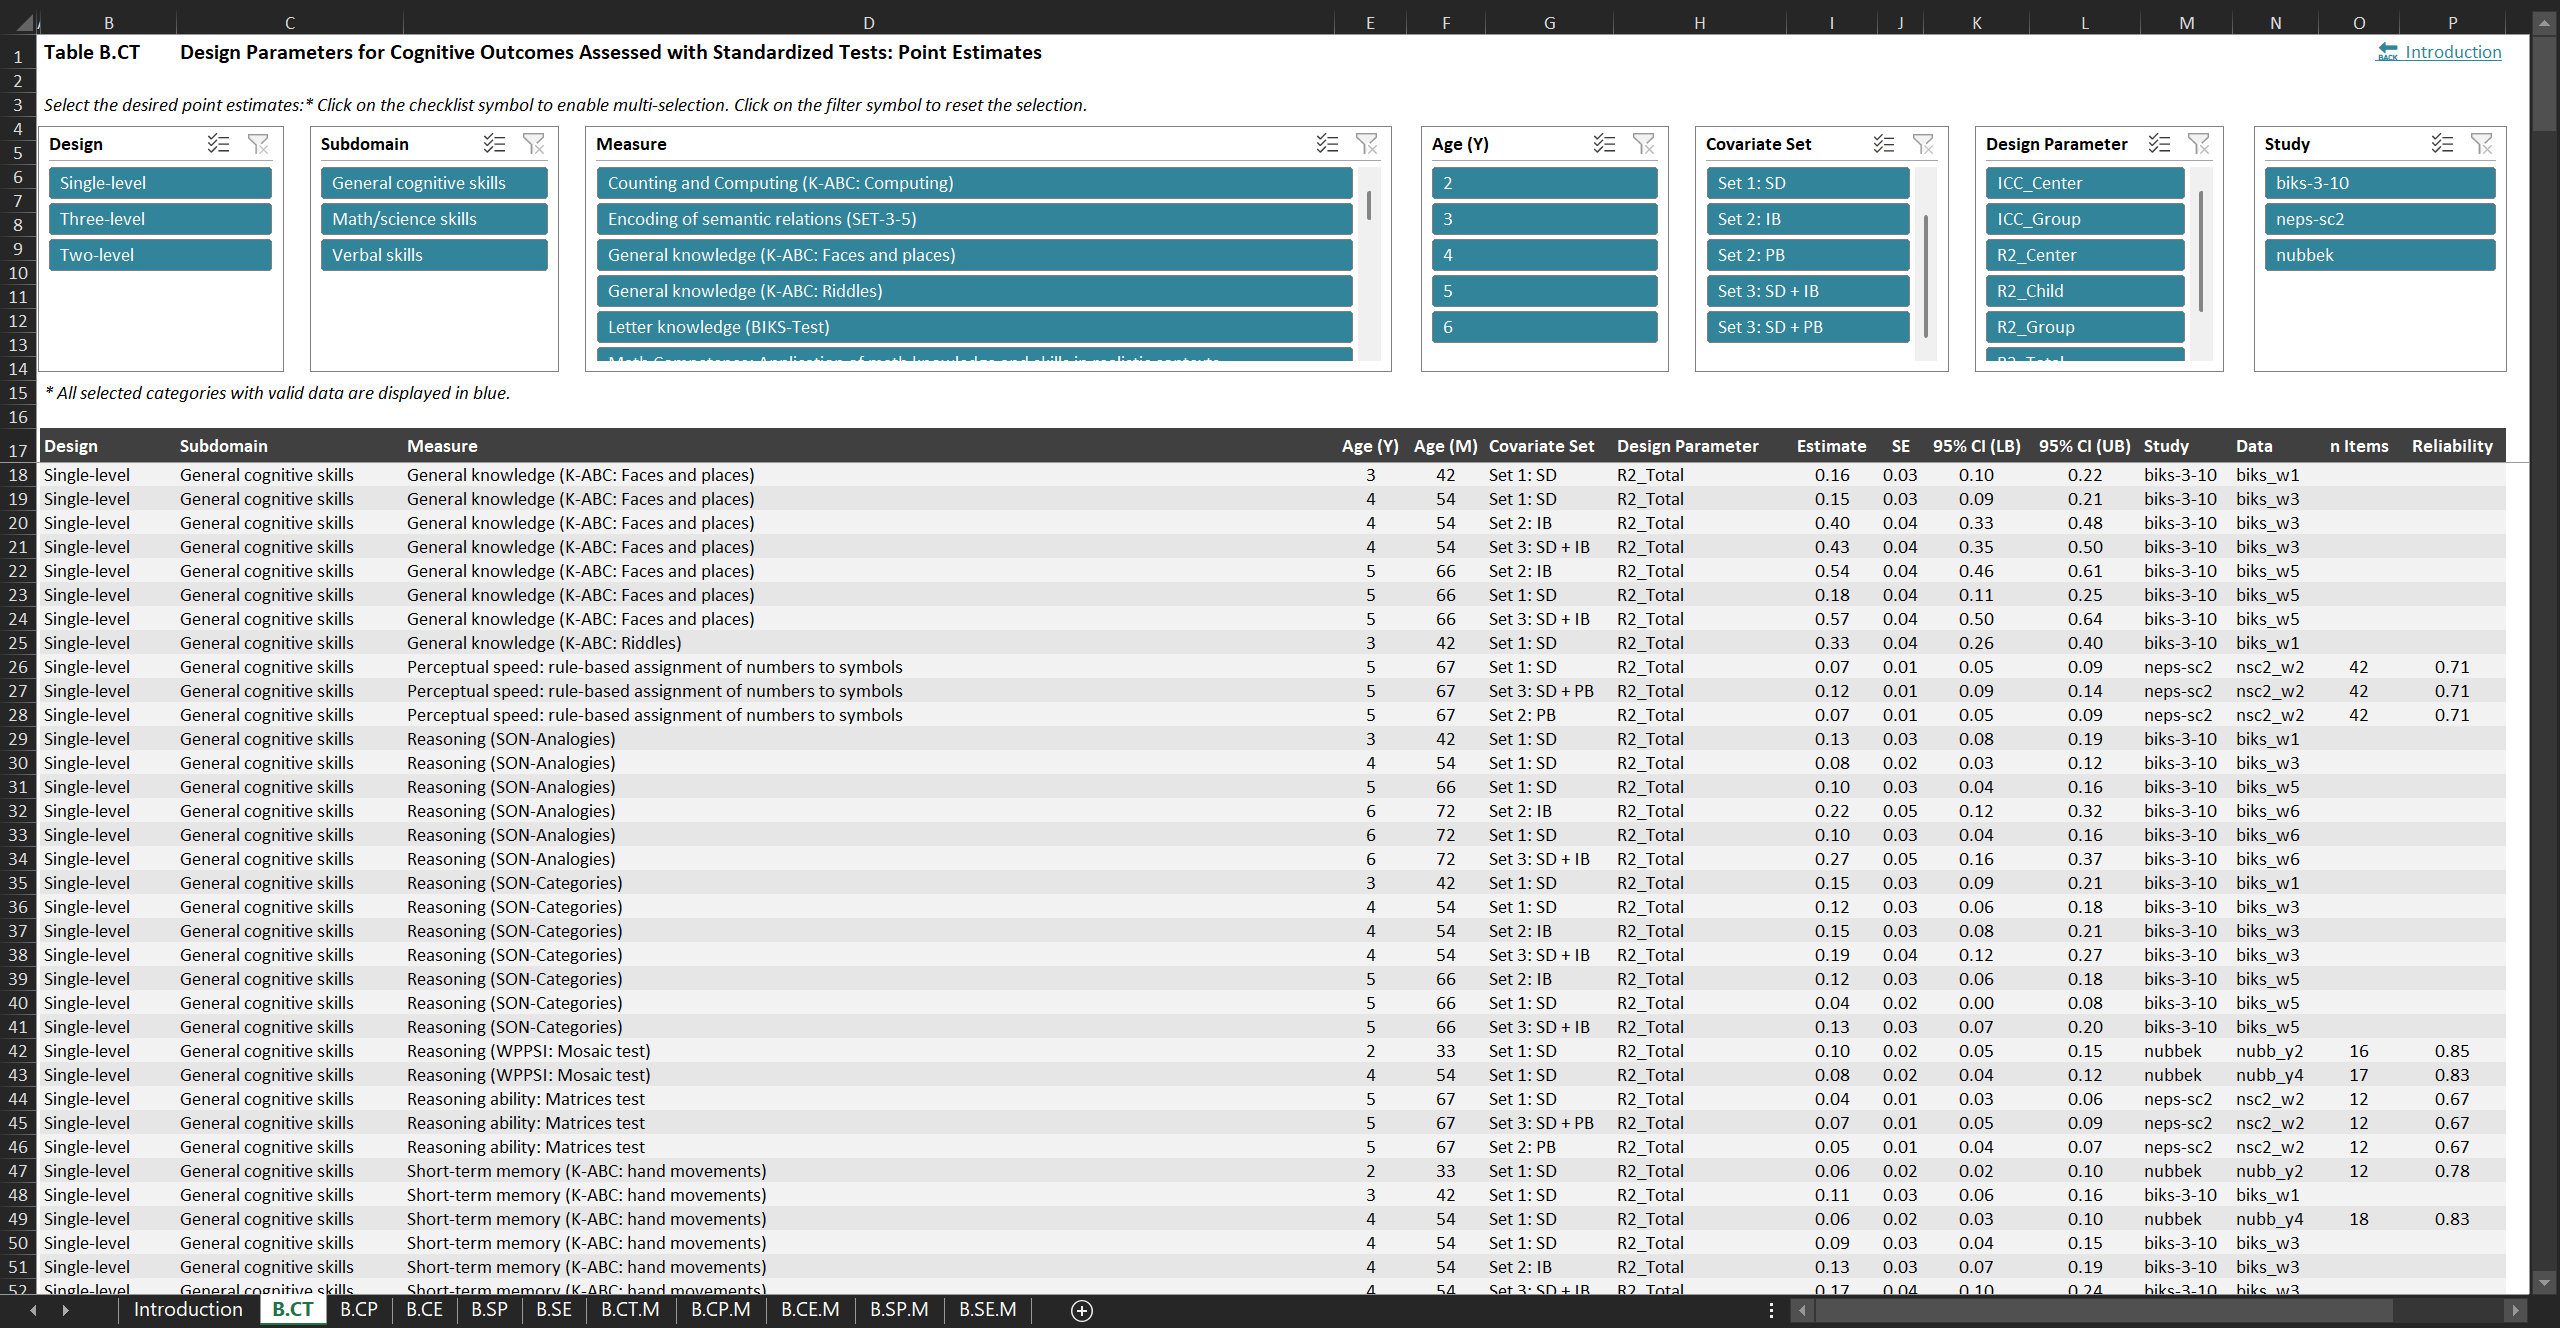
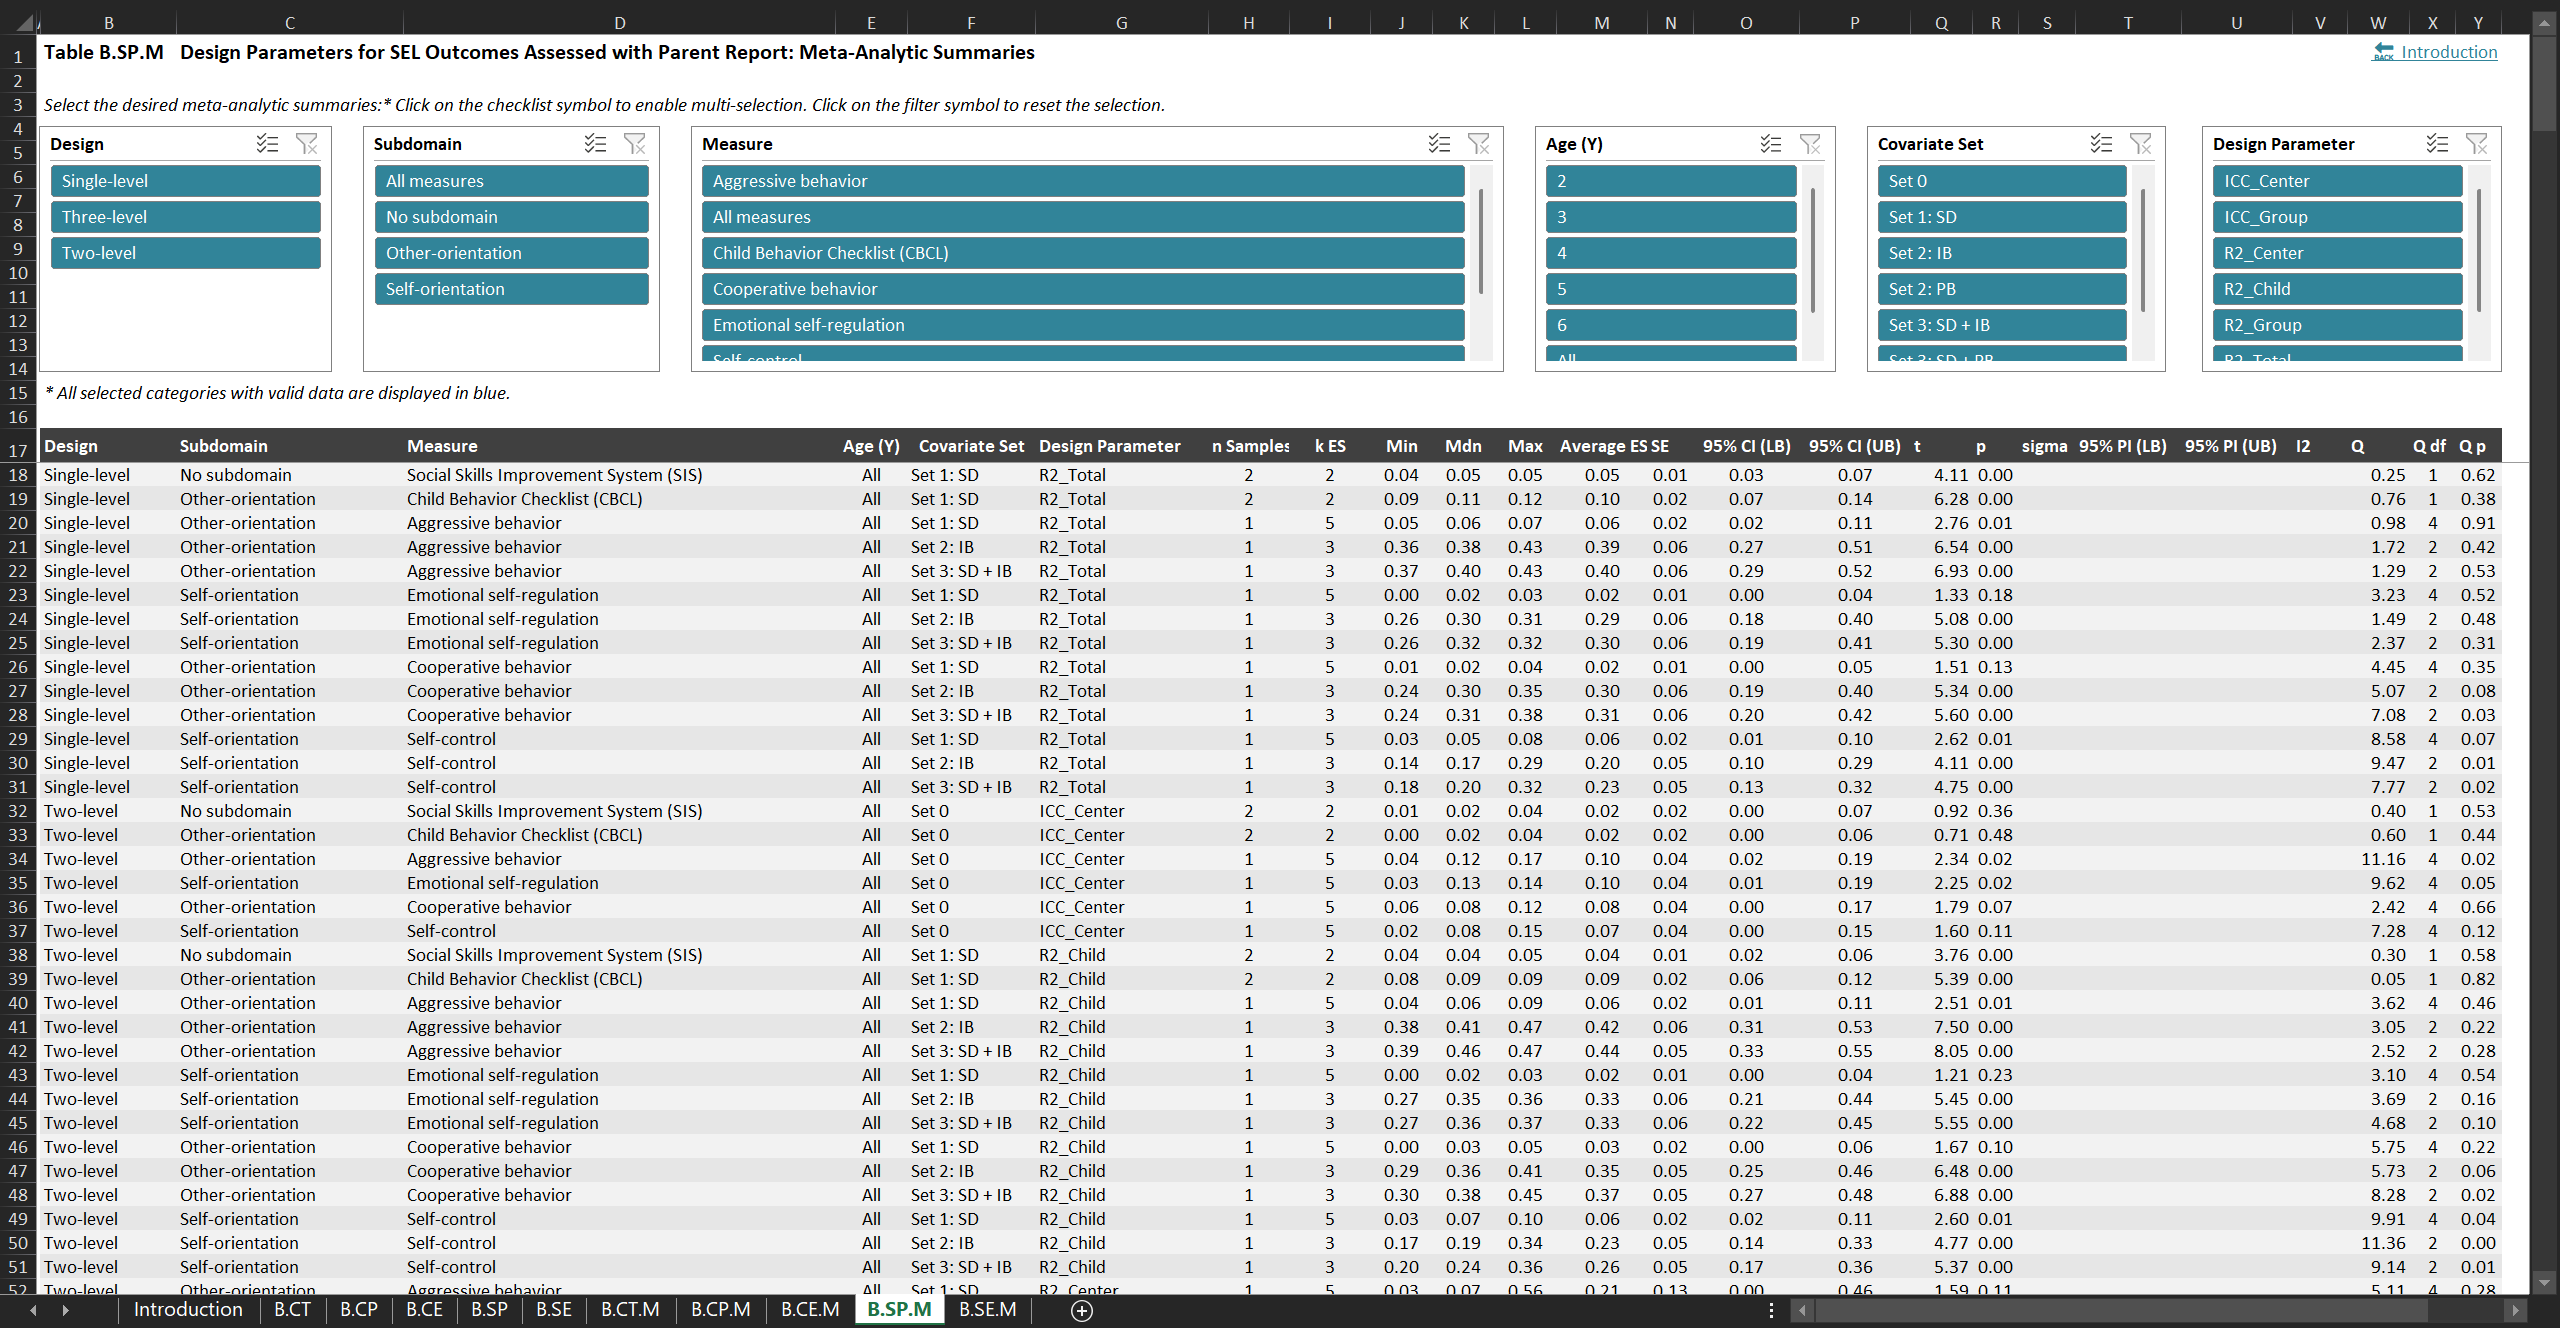
In Brunner et al. (2025), we estimated and meta-analyzed ρ and R2 values for preschool children’s cognitive as well as socio-emotional learning outcomes. For this purpose, we drew on a systematic collection of individual participant data from 4 German probability samples of 2- to 6-year-olds. The estimates are relevant for planning single-level (e.g., in non-clustered lab-based settings), two-level (children nested within daycare centers), and three-level (children nested within groups within daycare centers) RTs. The analyzed outcomes are assessed with three methods (standardized tests, parent ratings, and educator ratings). We also considered vital covariate sets (baseline measures, sociodemographic characteristics, and their combination).
Both the empirically estimated and meta-analytically integrated design parameters are compiled in an Excel file featuring interactive tables with various filtering and selection functionalities. This allows users to easily access the design parameters that align with specific characteristics of the target intervention. The respective Online Supplemental Material B can be downloaded from the study’s OSF repo.
Effect Size Benchmarks for the German School Context
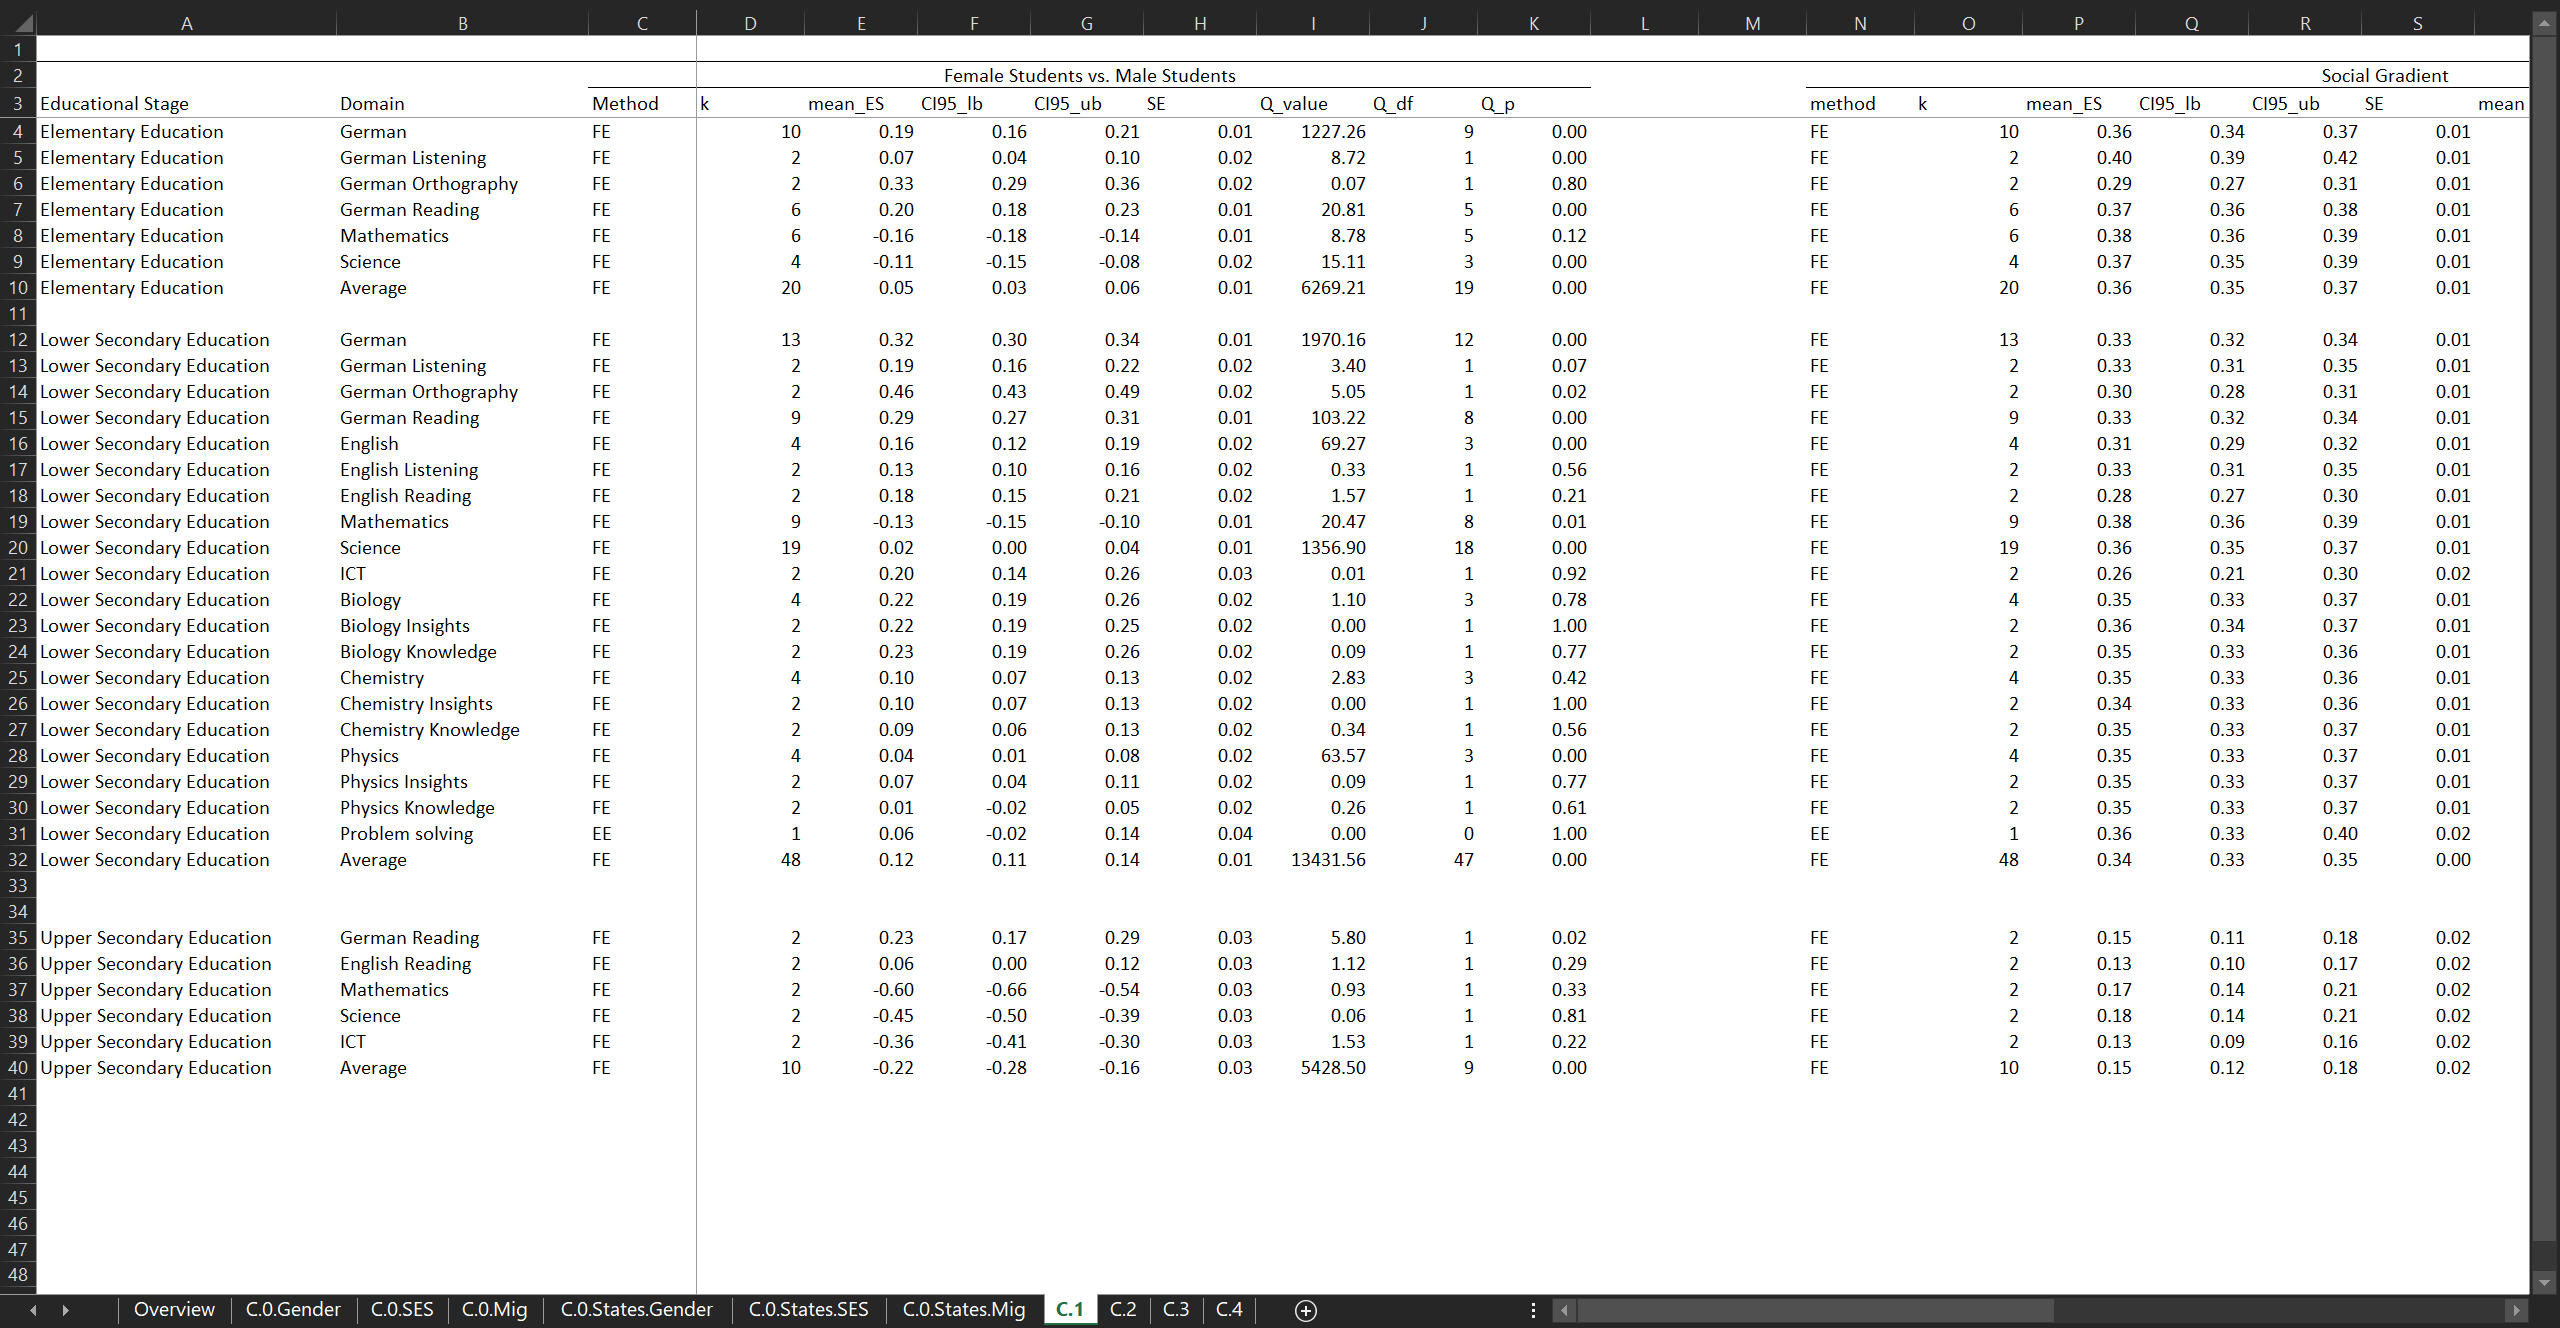
Brunner et al. (2023)
Our novel (meta-analytic) effect sizes to interpret results from intervention studies on student achievement across the entire school career
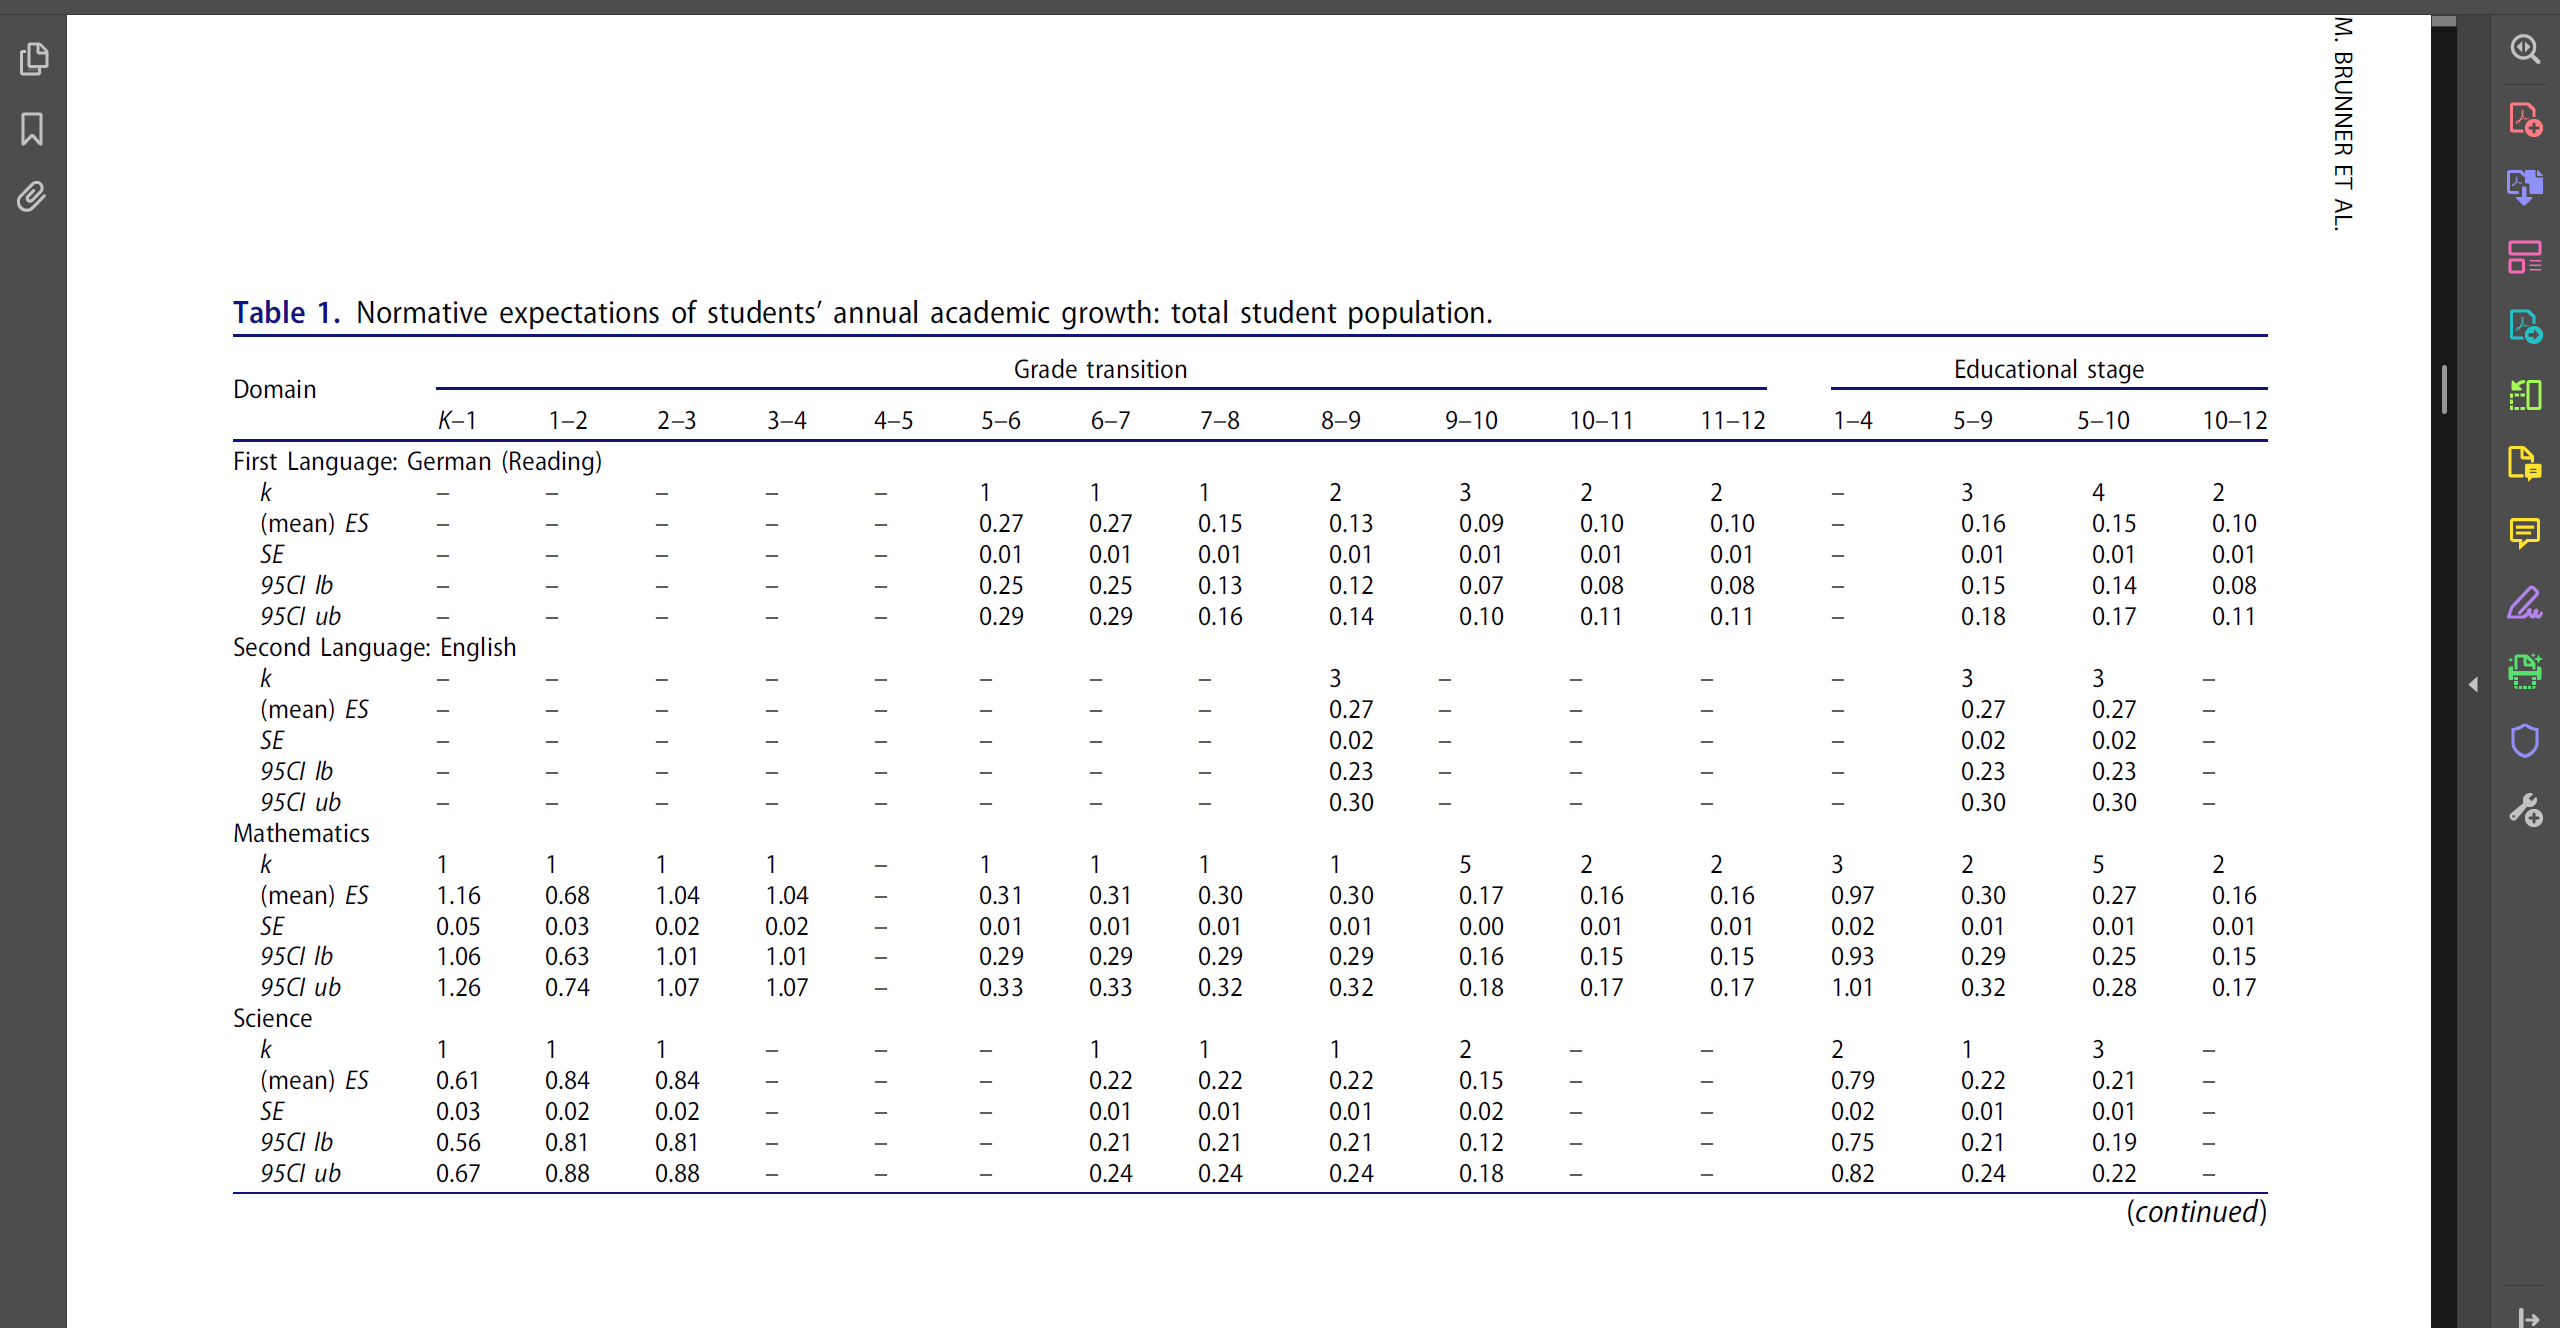
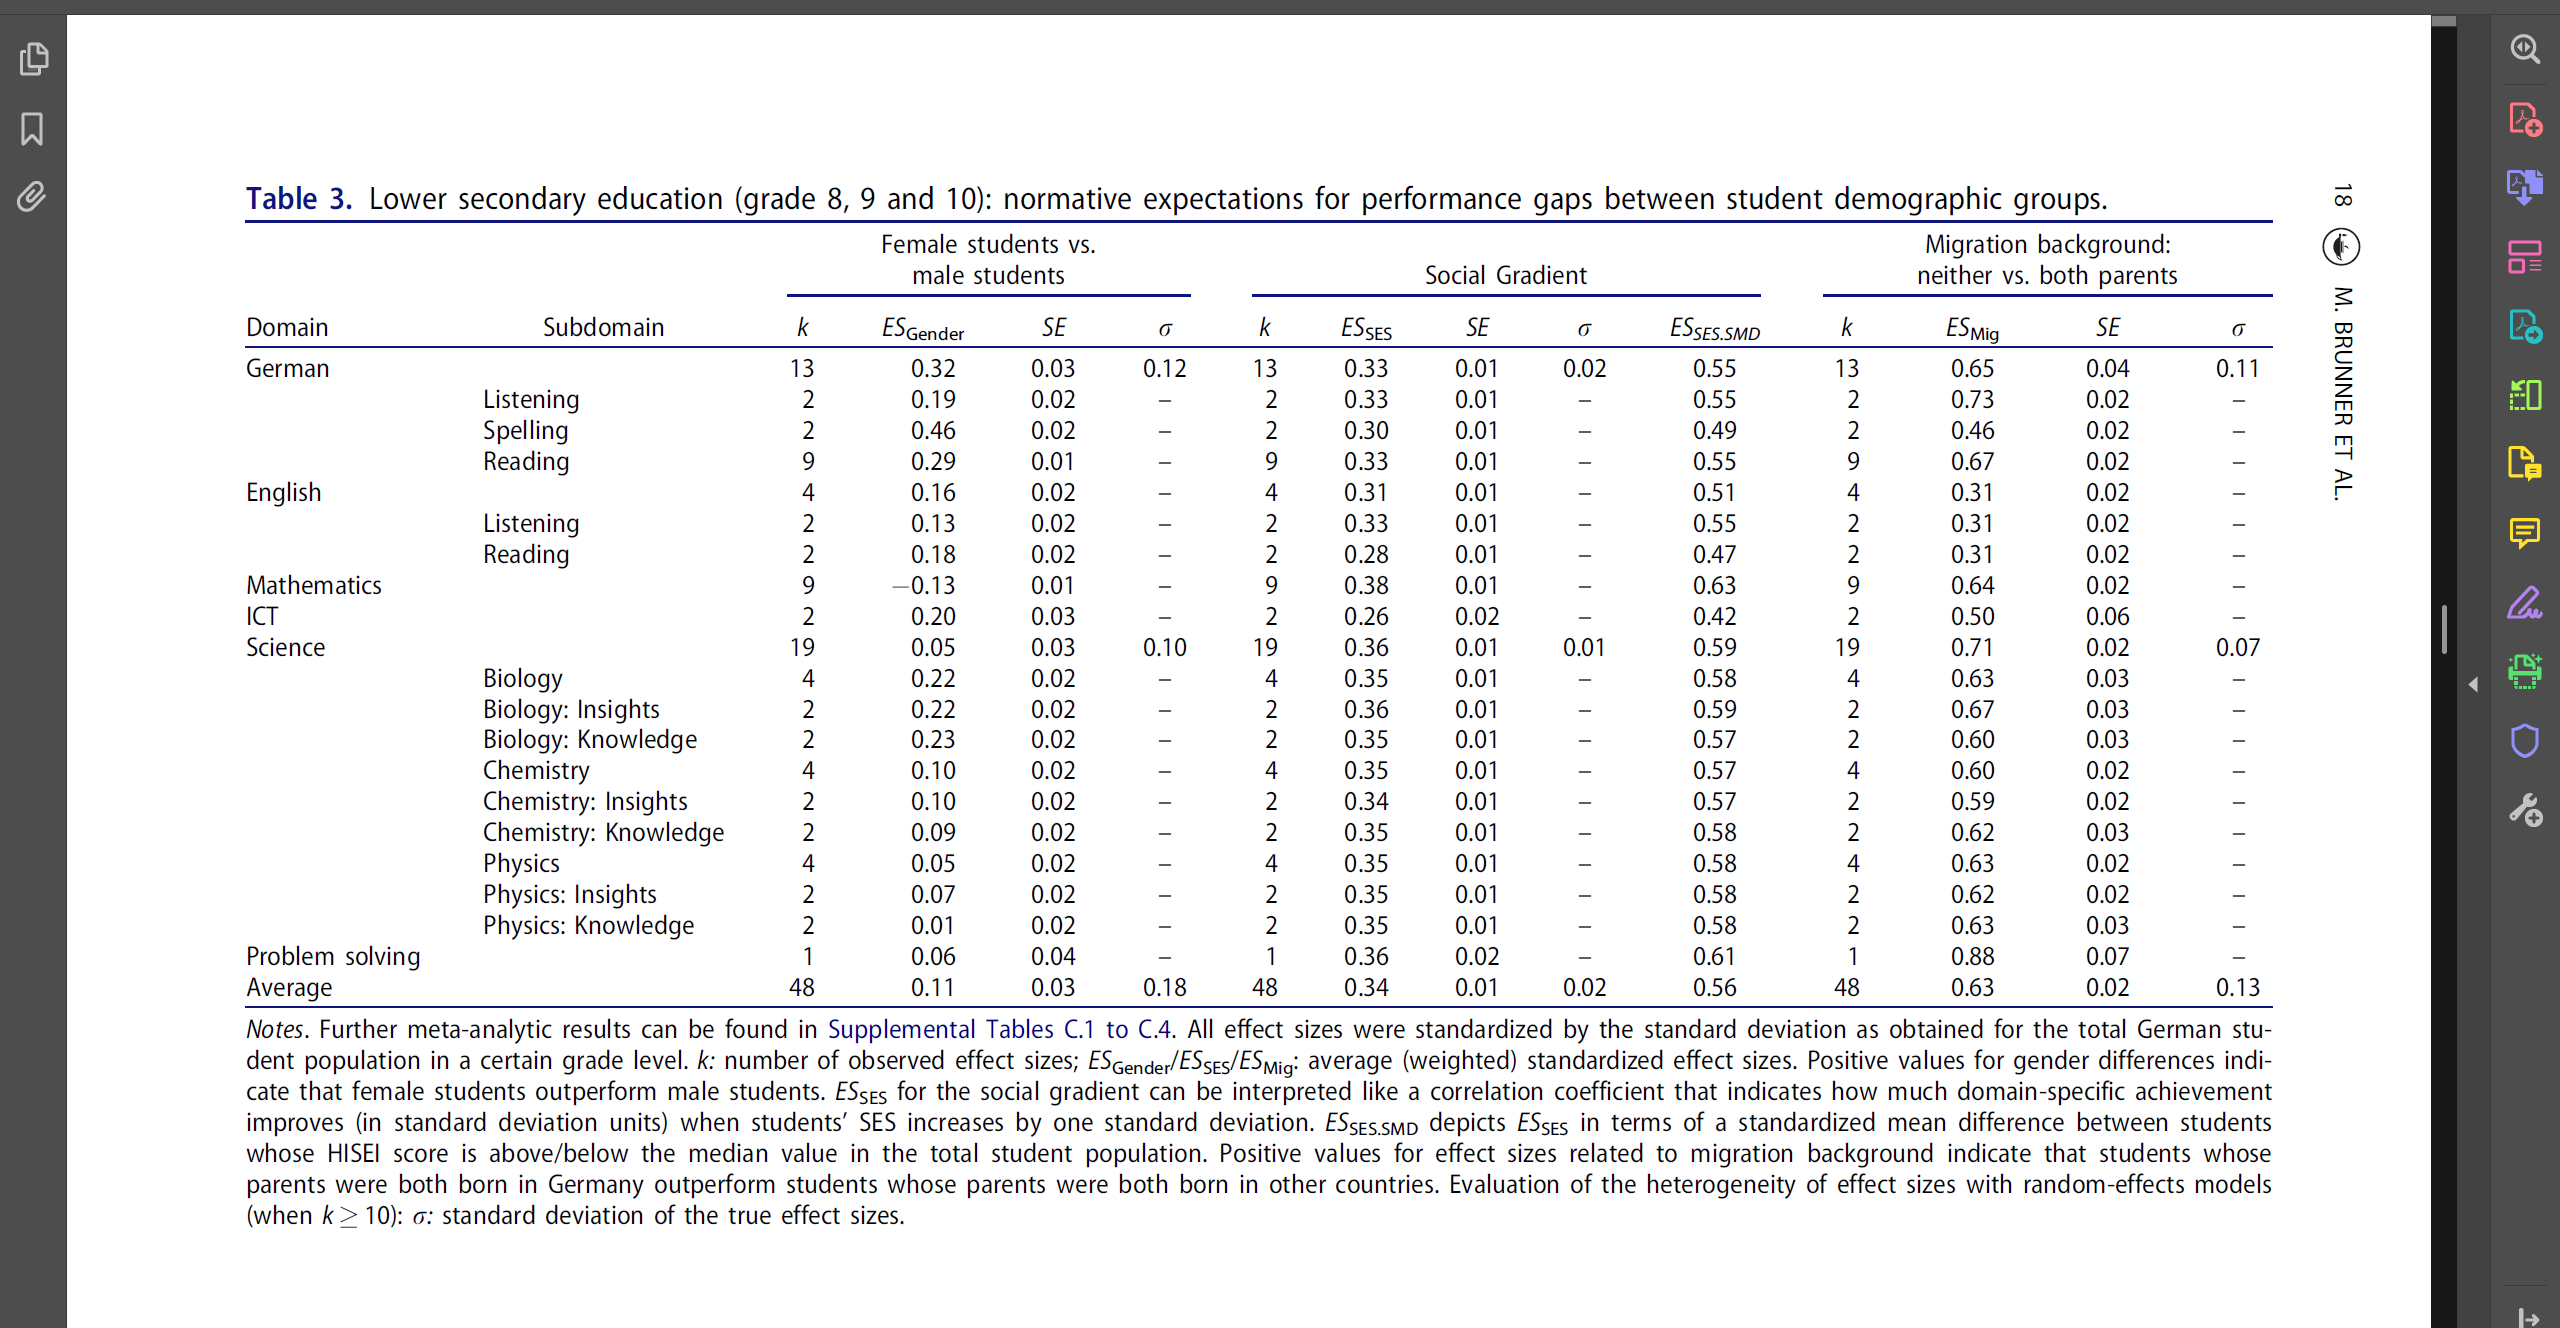
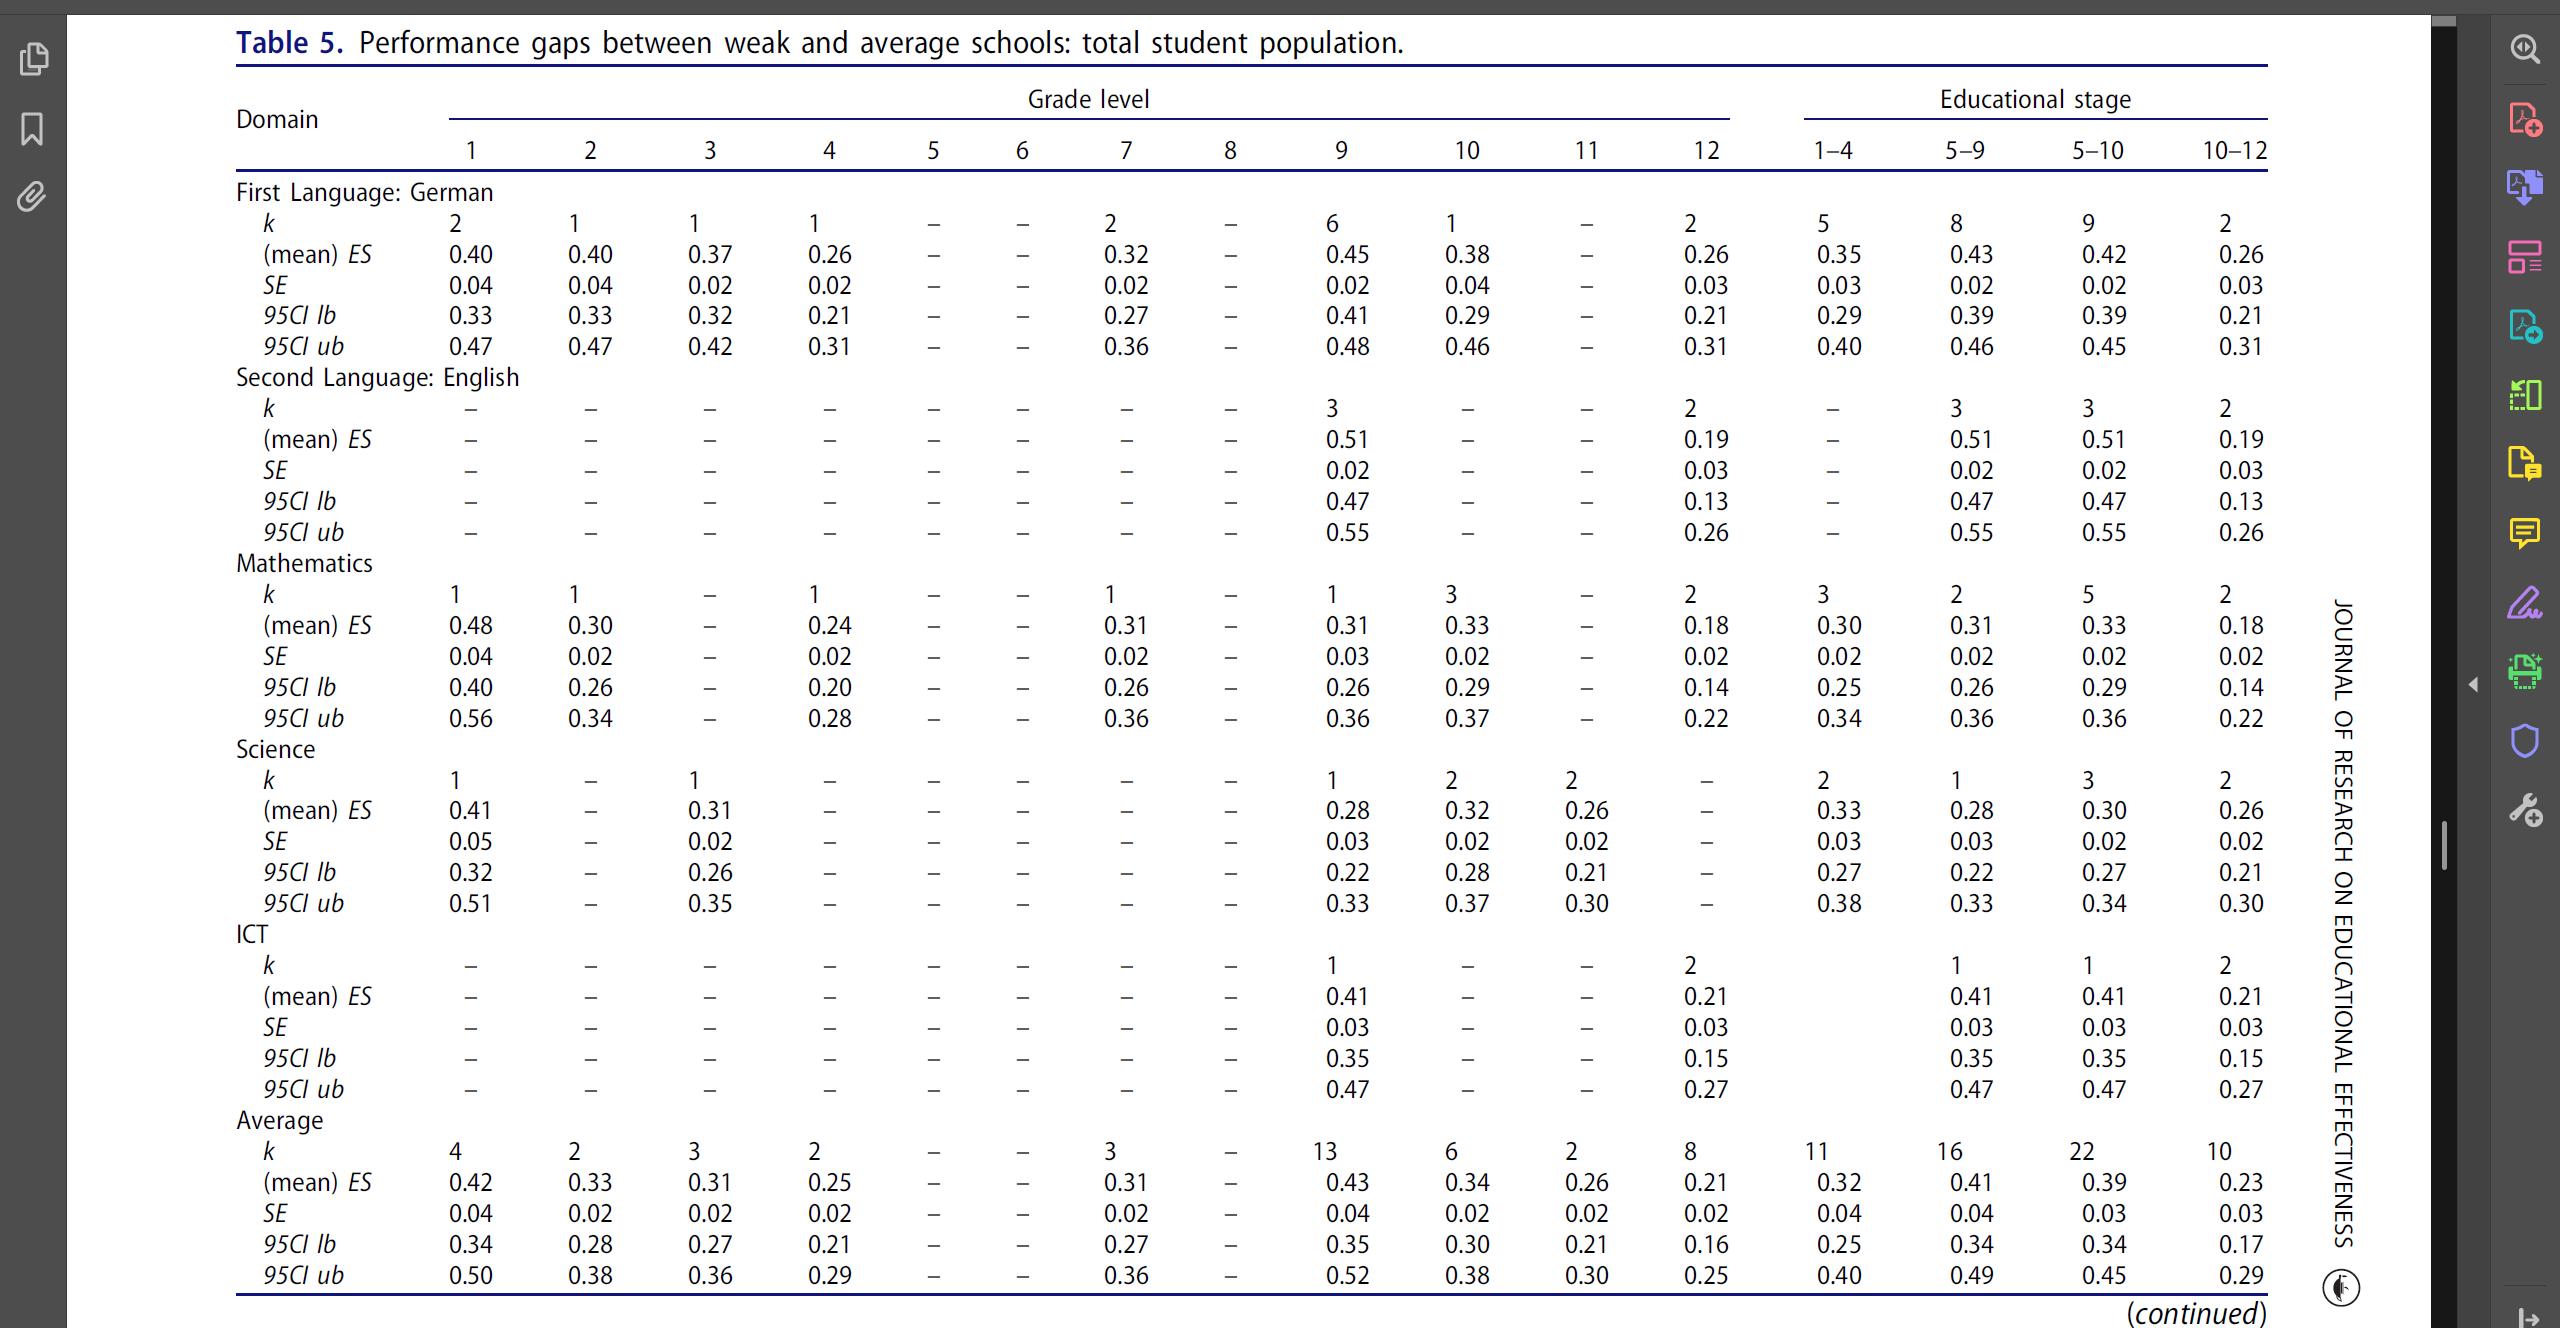
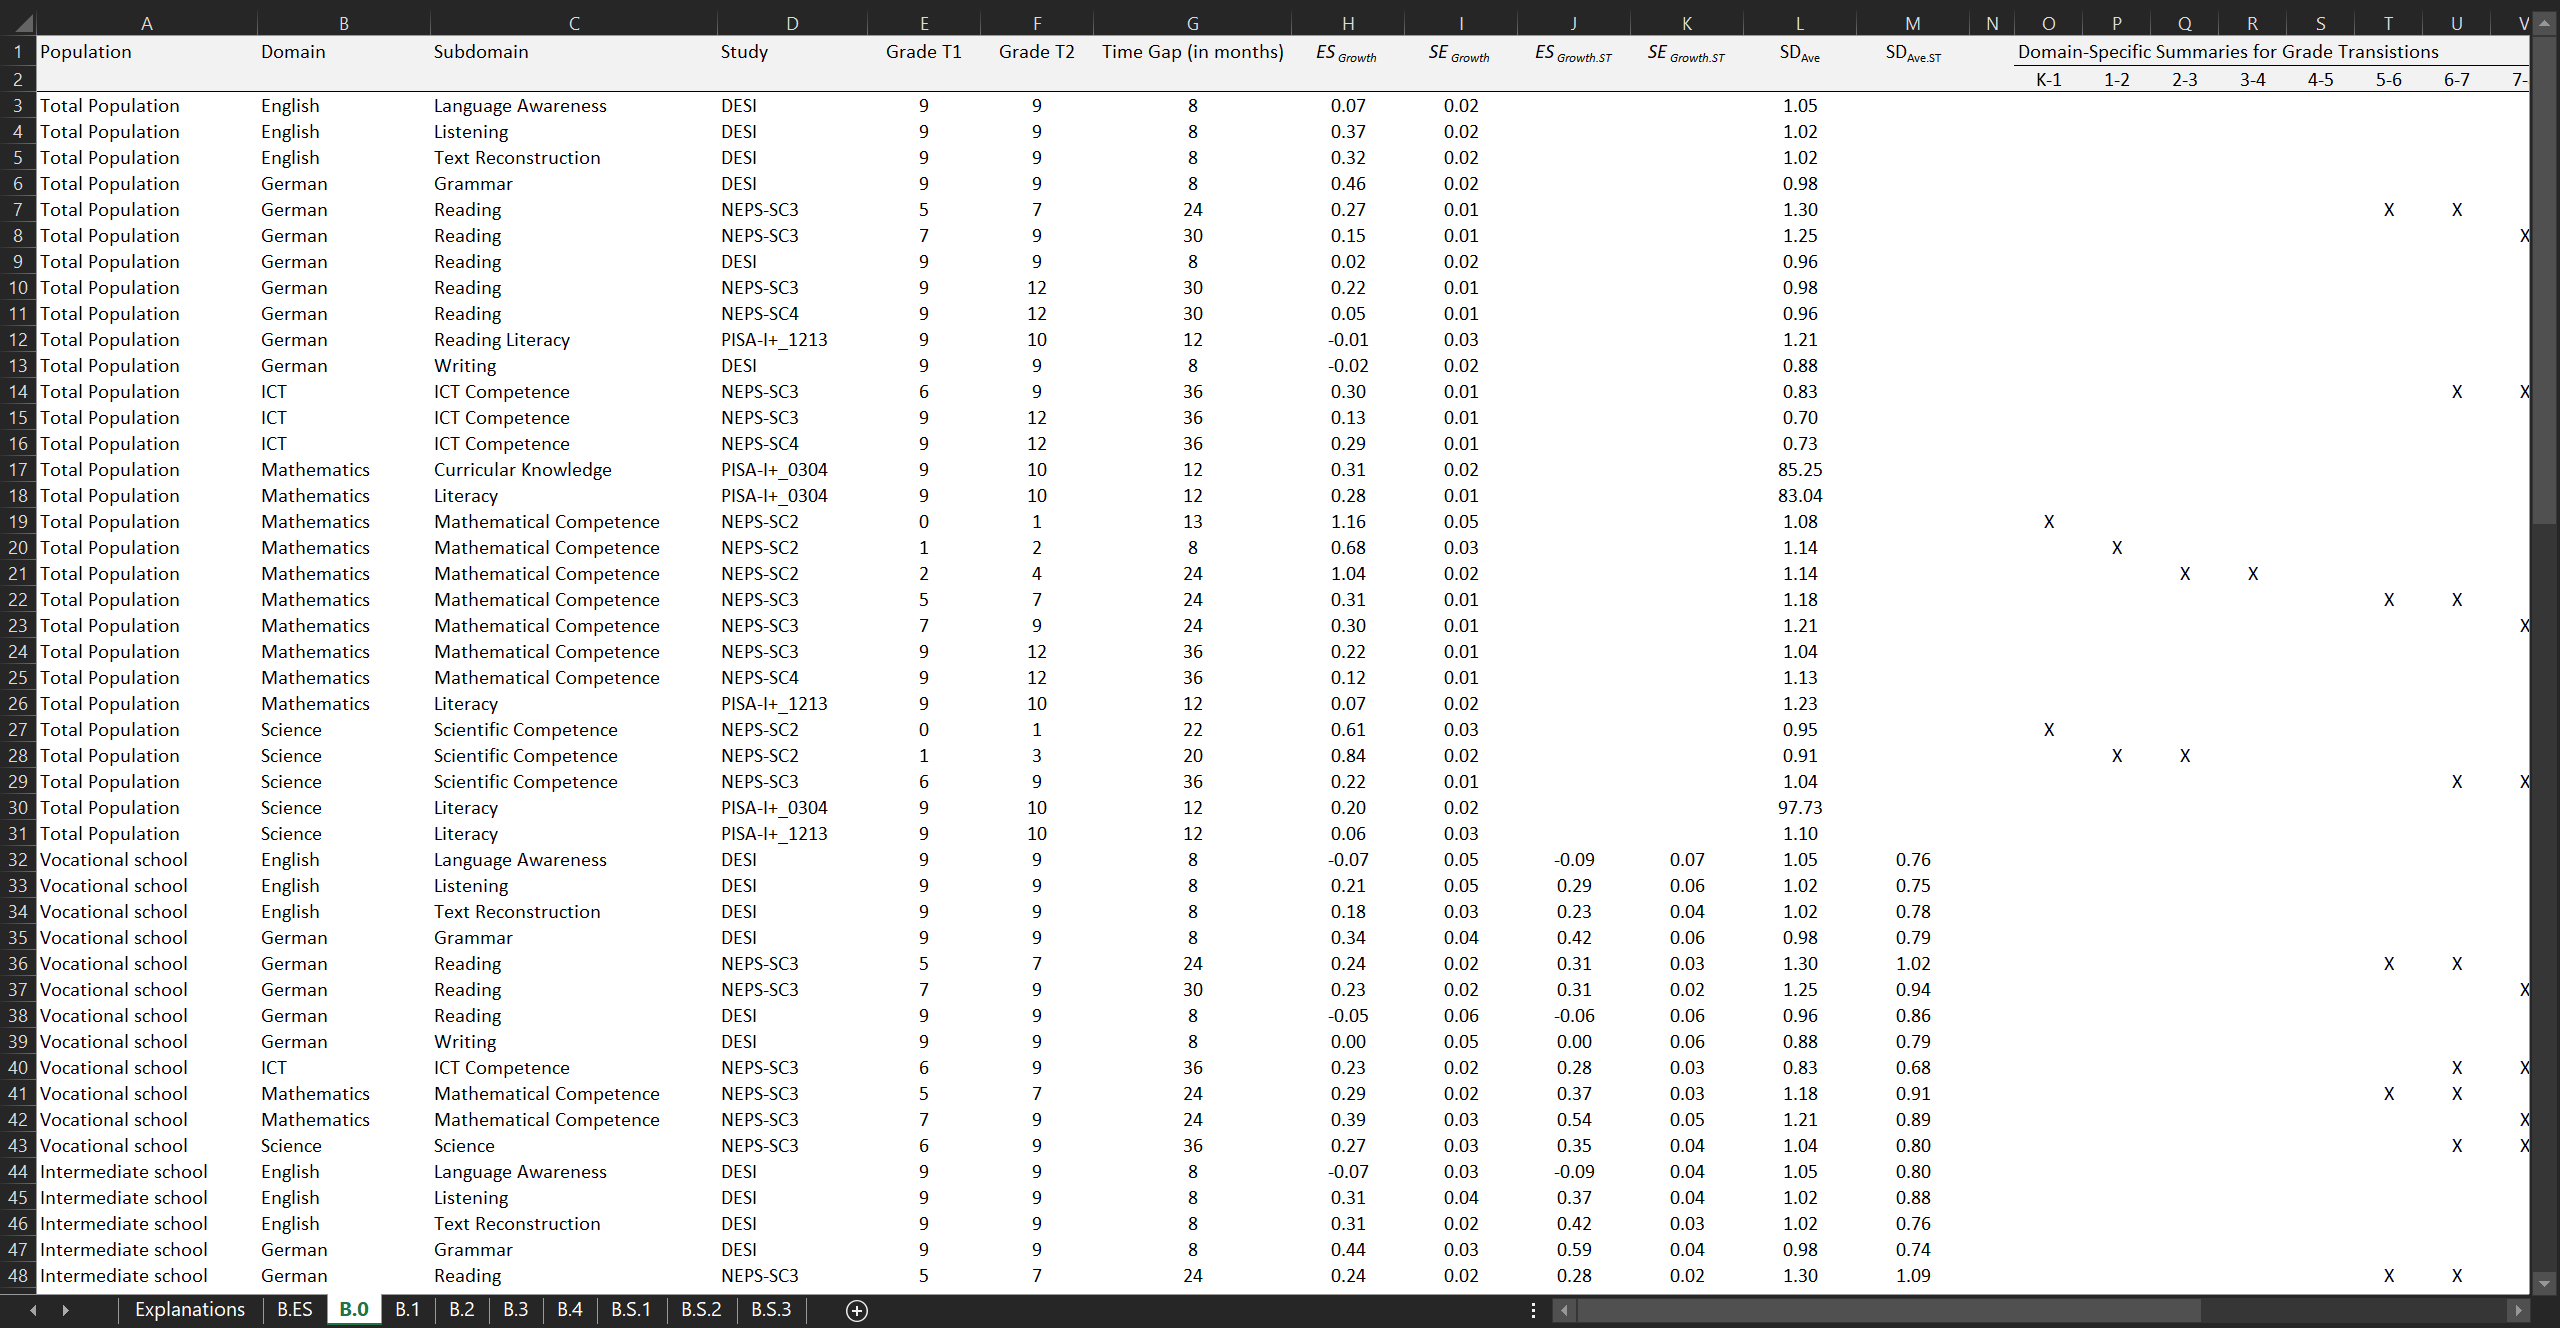
In Brunner et al. (2023), we gathered a vast collection of meta-analytically aggregated effect size benchmarks for various achievement outcomes of 1st to 12th graders–a resource that is especially valuable as it is the first of its kind in the German school system. Specifically, we generated estimates of normative expectations for students’ academic growth as well as of performance gaps between weak and average schools or between policy-relevant, demographically defined groups. We used longitudinal data from six large probability samples of four German large-scale assessments (NEPS, PISA-I+ 2003, PISA-I+ 2012, and DESI).
The effect size benchmarks are listed in Tables 1 to 5 of the article, available on the Journal’s website.
Further effect size benchmarks (e.g., from previous research, for specific school types and federal states) are documented in various Excel files. The respective Online Supplemental Materials B, C, and D can be downloaded from the study’s OSF repo or from the Journal’s website.
International Design Parameters
Brunner et al. (2018)
Our world-wide diversified multilevel design parameters for student achievement, affect and motivation, and learning strategies
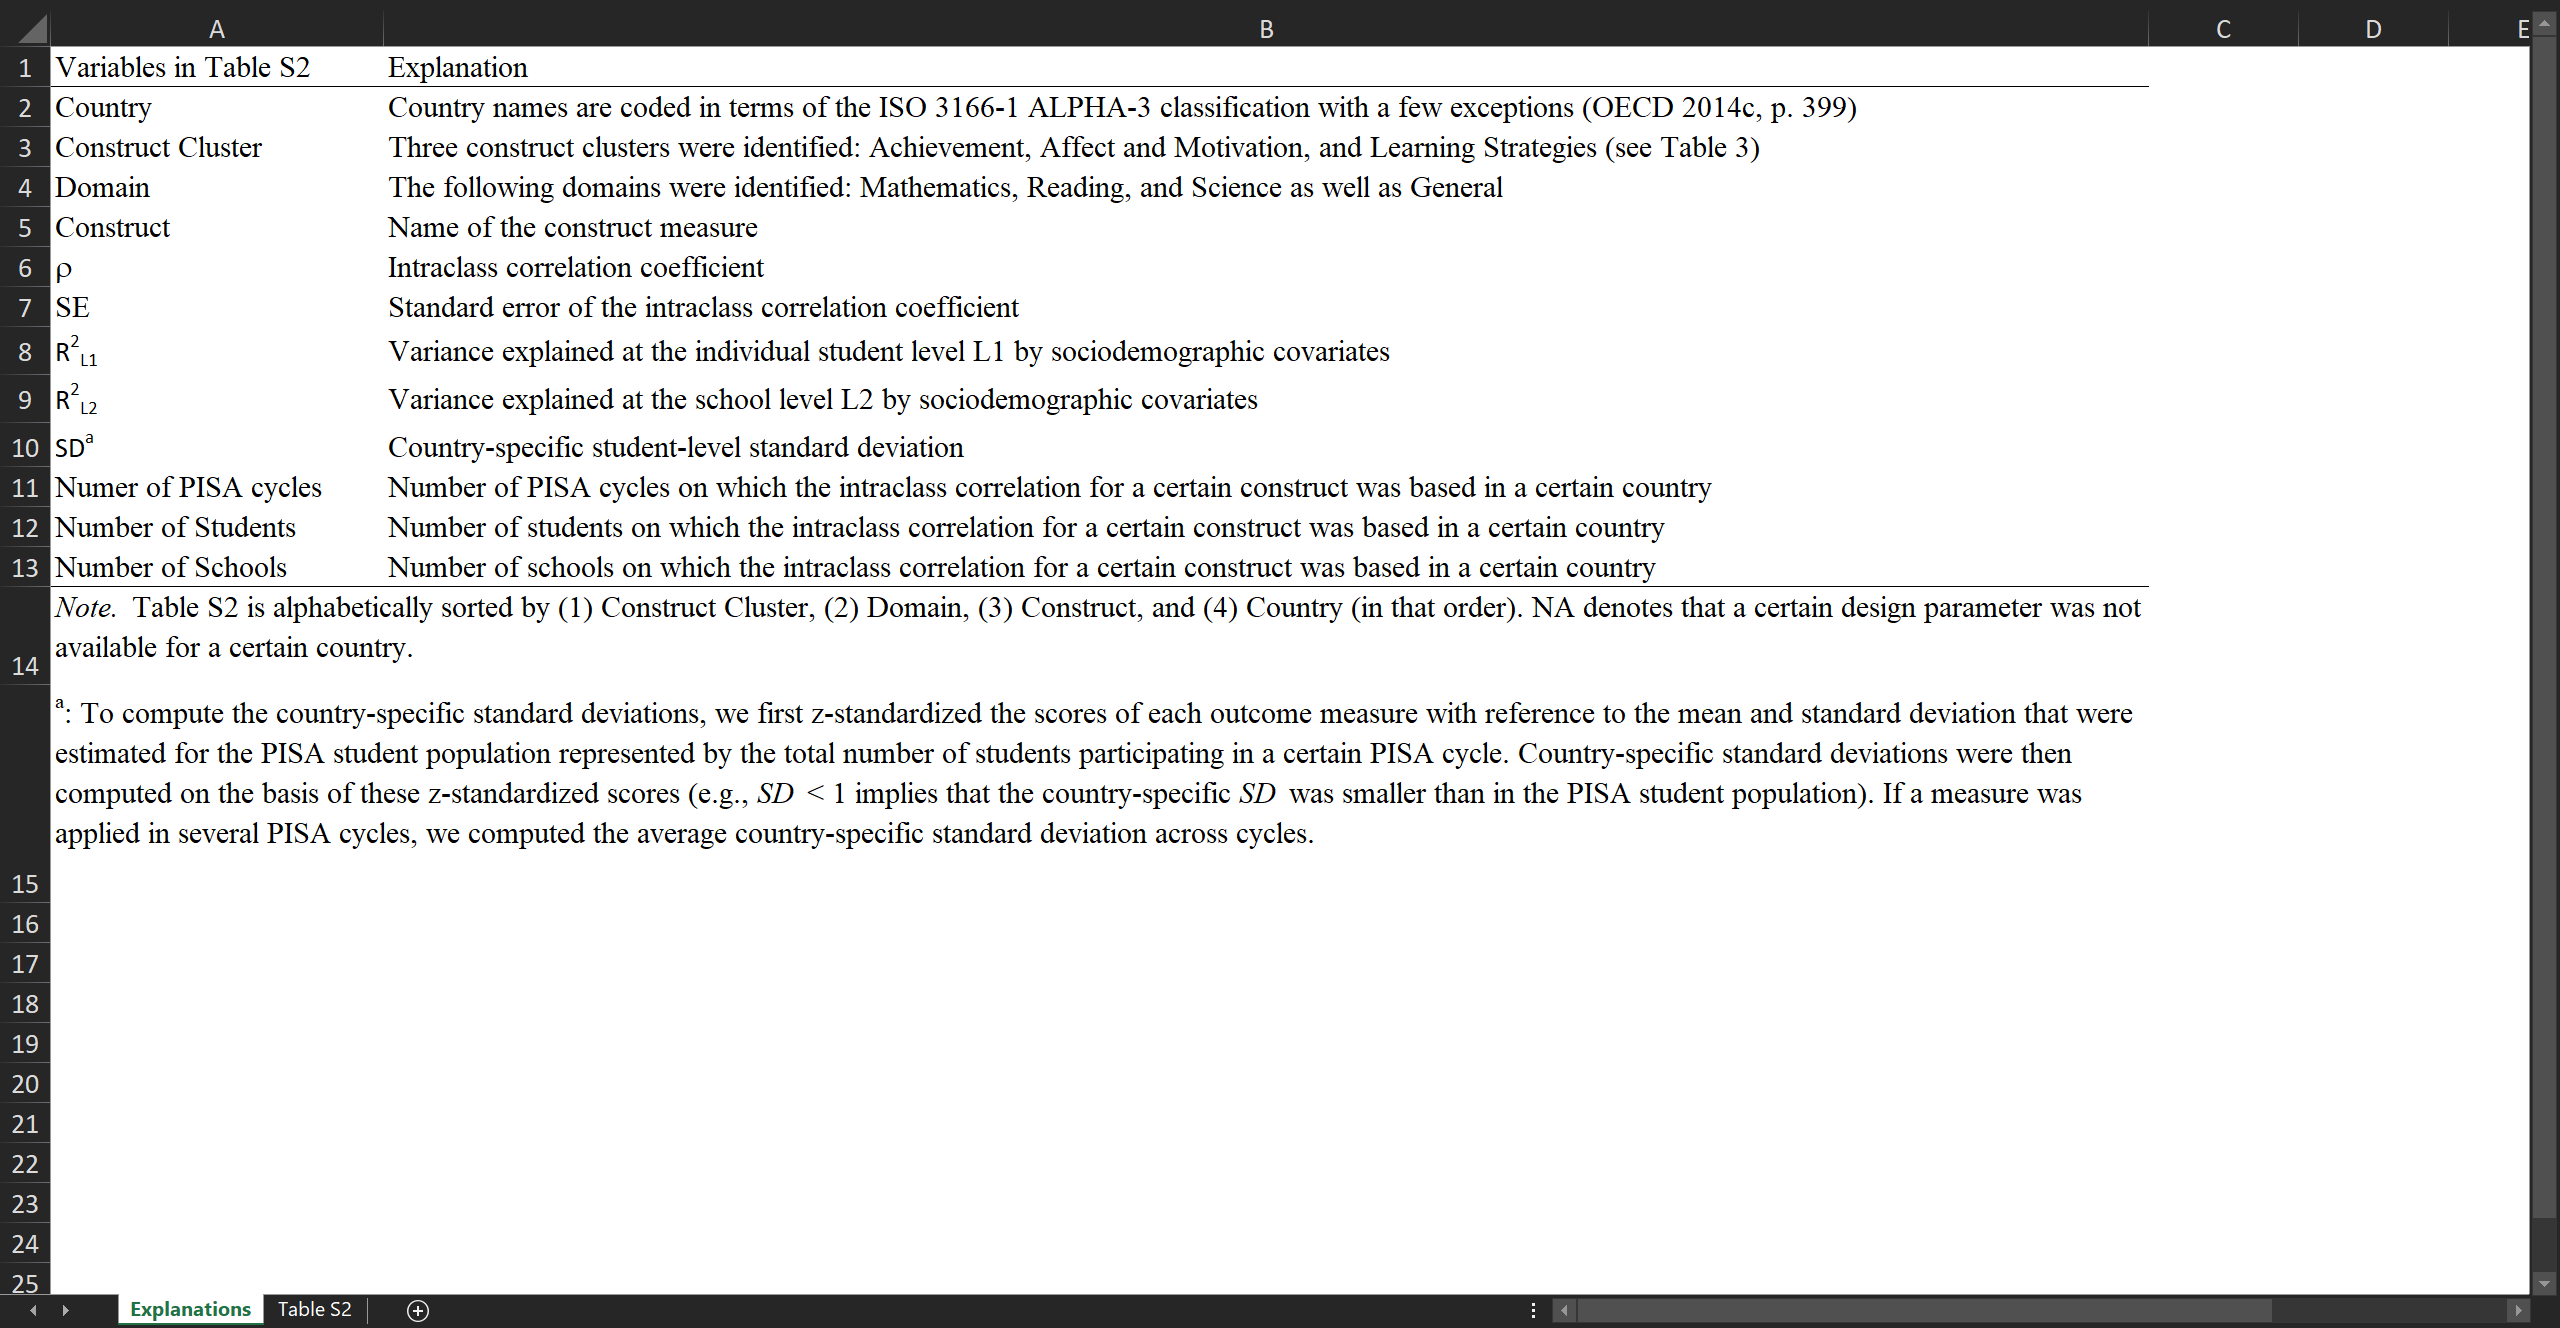
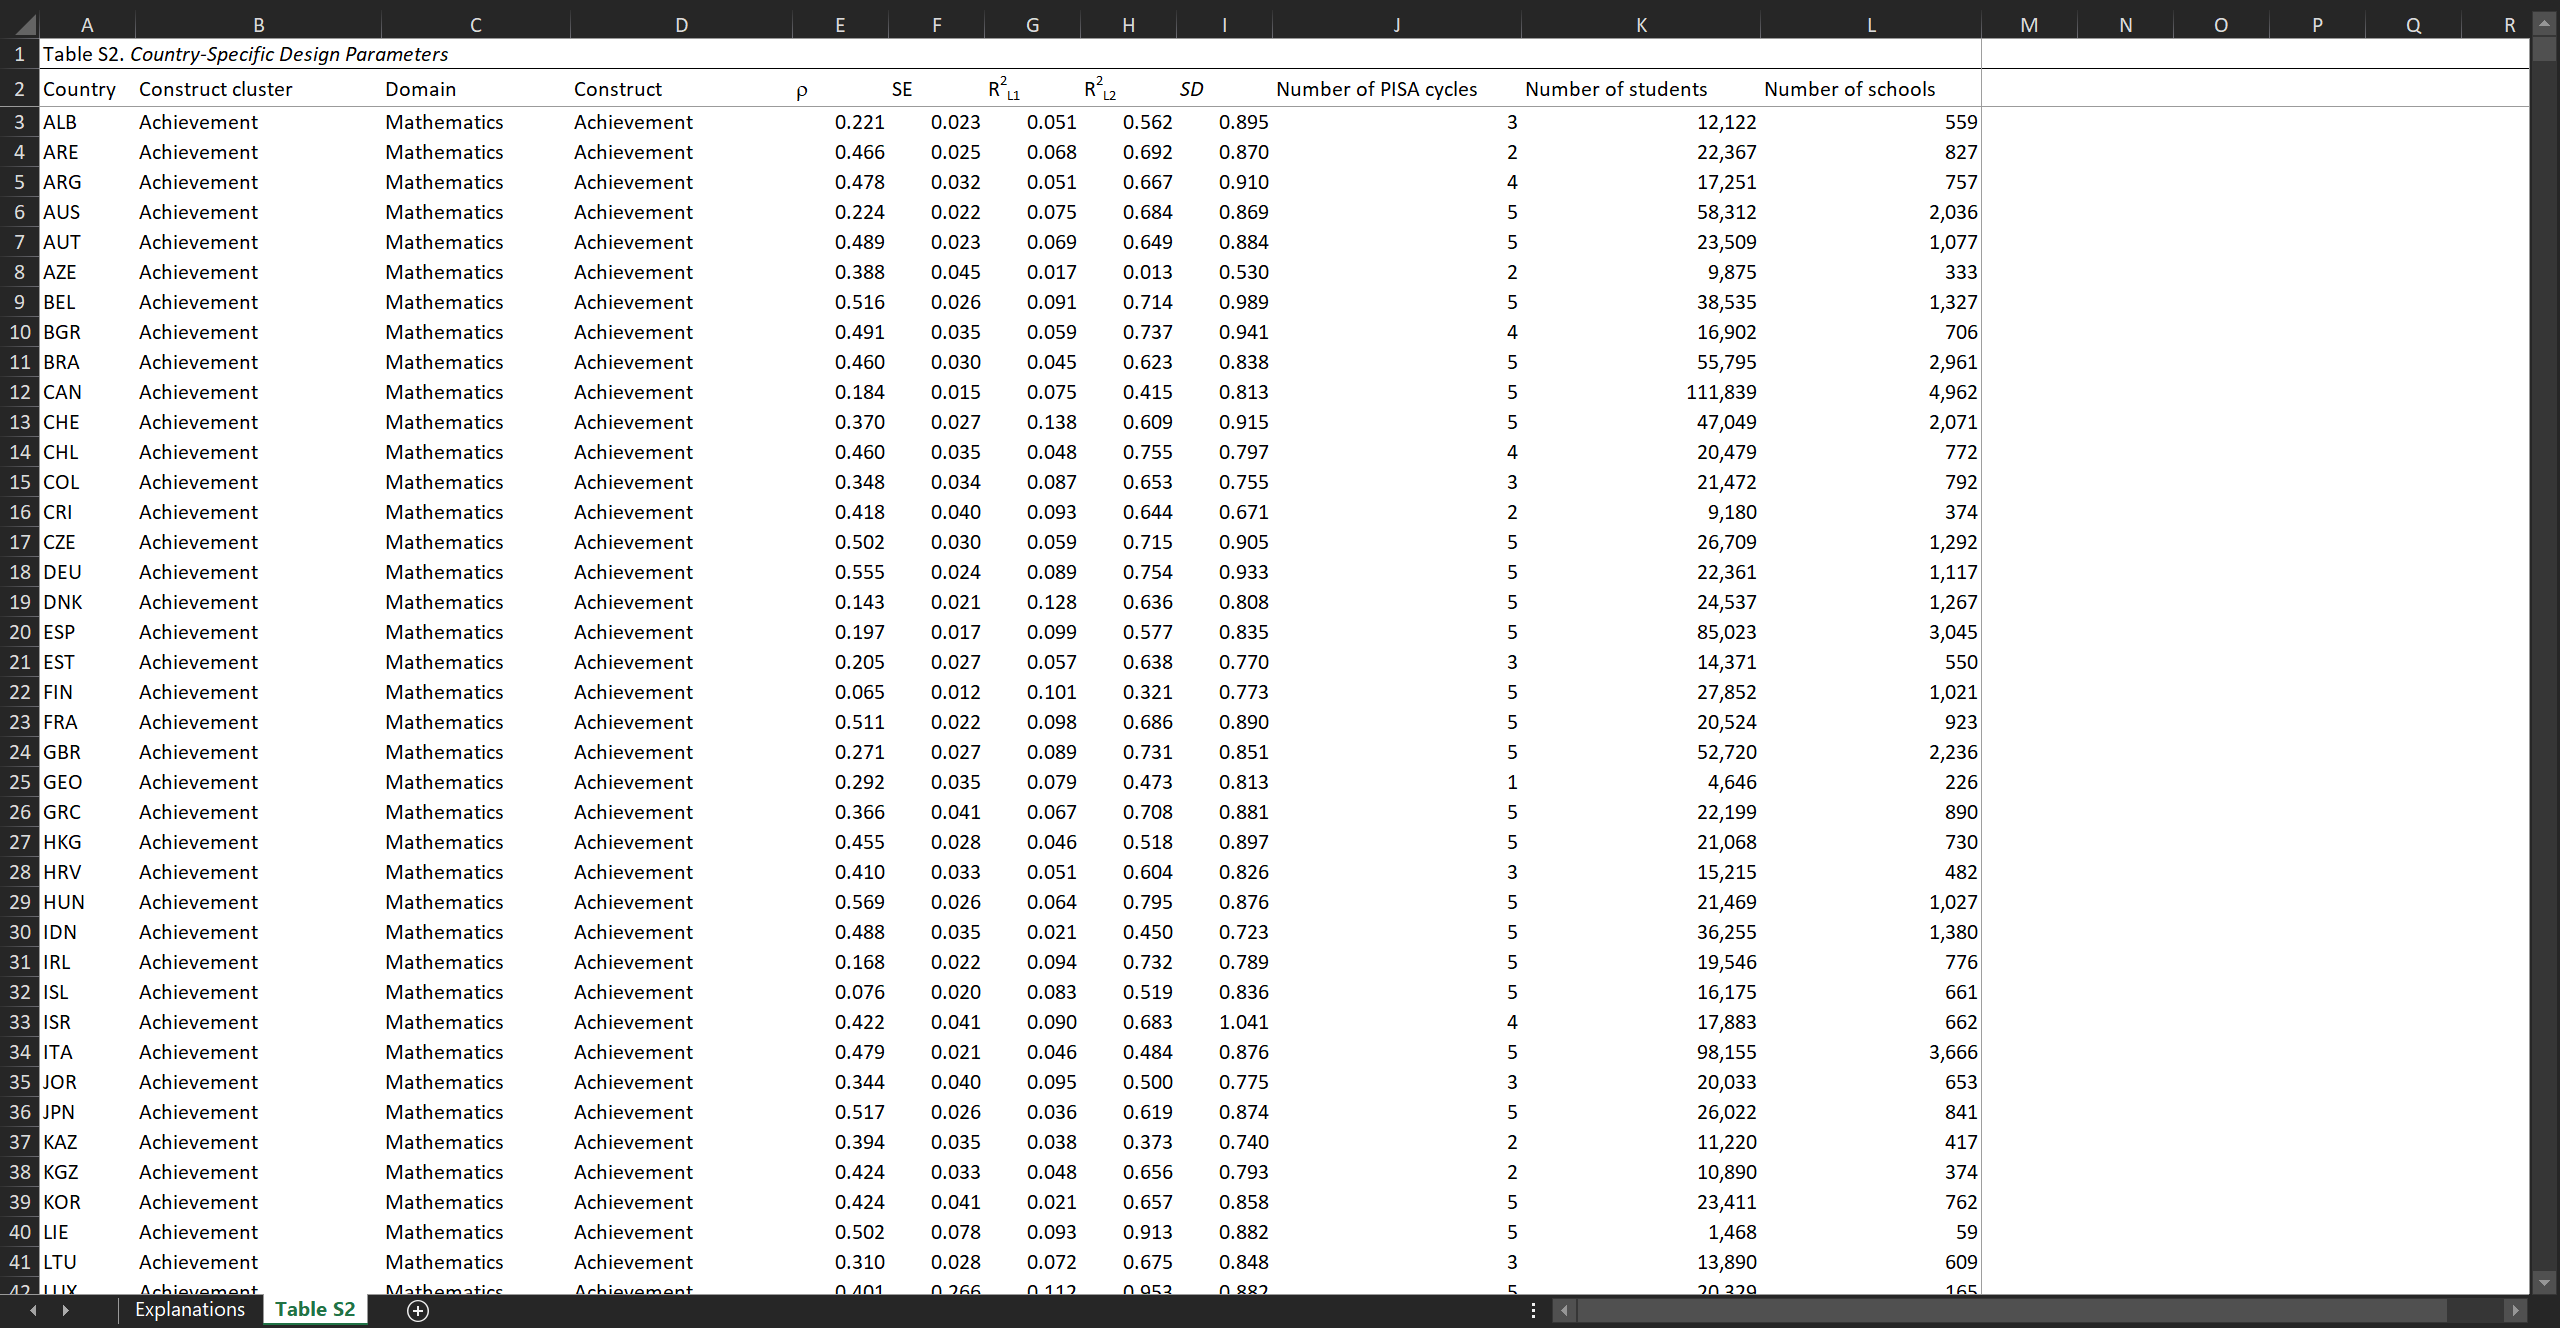
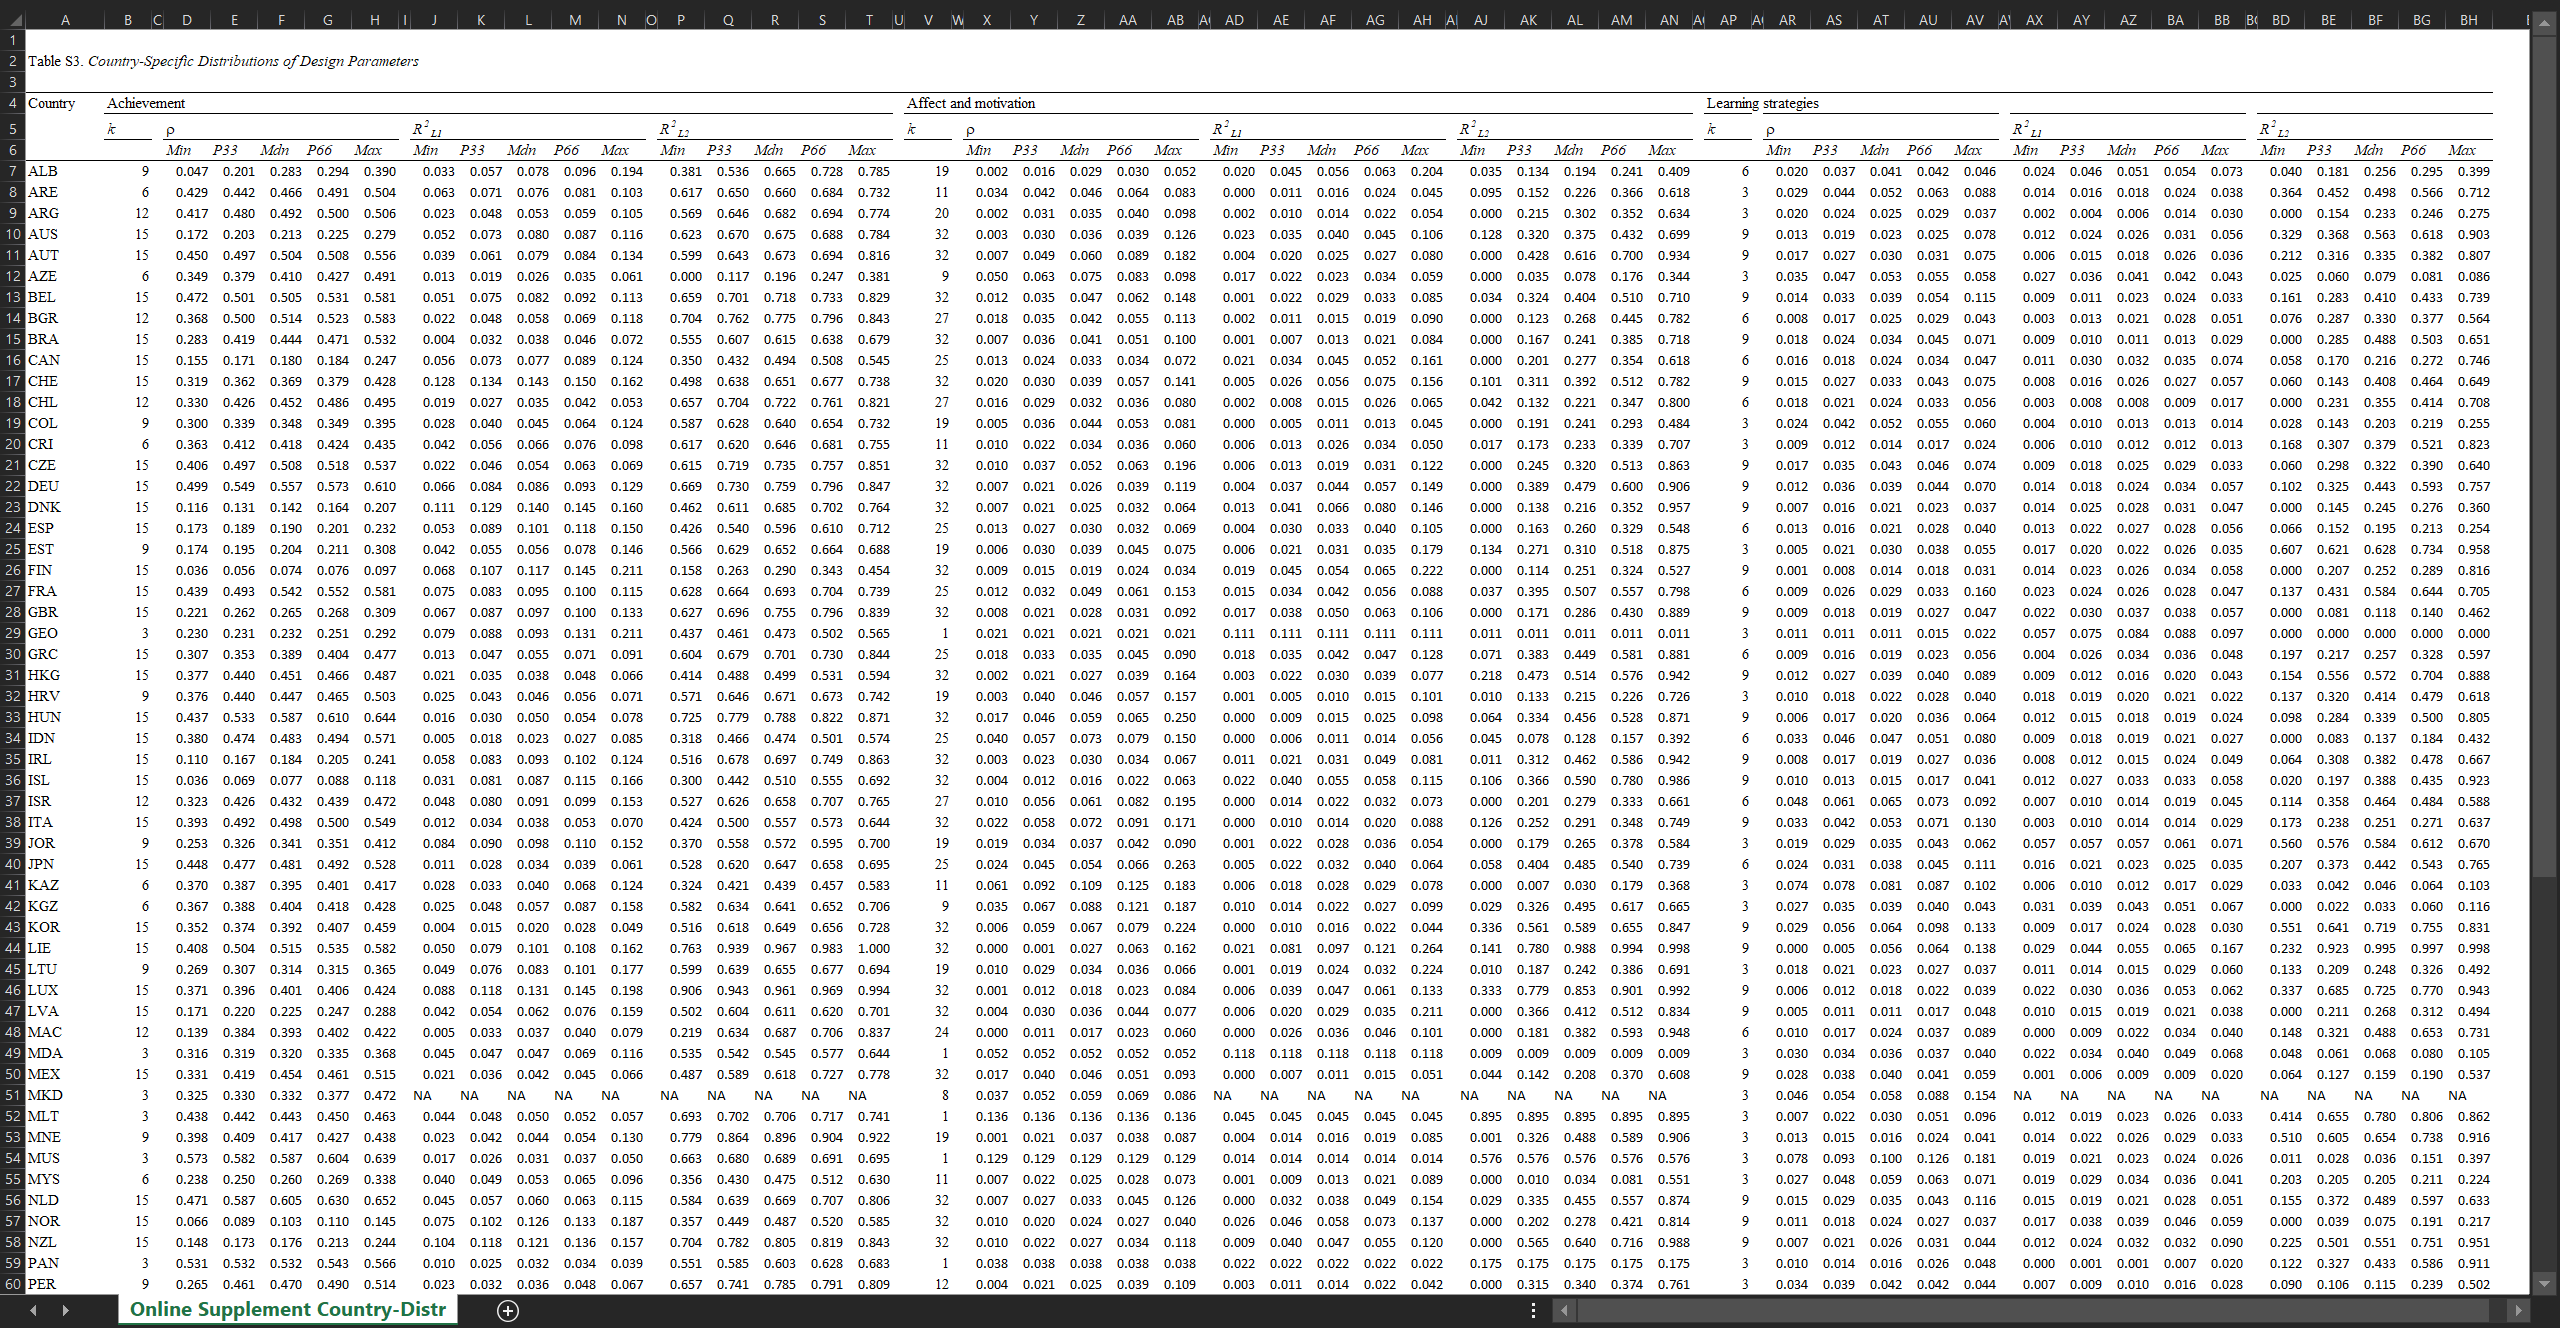
In their cross-country research, Brunner et al. (2018) estimated a broad spectrum of two-level (students within schools) ρ and R2 values for 15-year-olds’ domain-specific and domain-general academic outcomes. The authors capitalized on representative, cross-sectional large-scale assessment data for 81 nations and economies from five PISA cycles in the years 2000, 2003, 2006, 2009, and 2012. Sociodemographic characteristics were employed as covariates. The estimates are also summarized in terms of normative distributions.
The design parameters are provided as an extensive Excel file, which can be downloaded from the Journal’s website.