Design Parameters
To plan sensitive (i.e., sufficiently powered and precise) RTs on student achievement, reliable estimates of design parameters that adequately mirror the (clustered) variance structure of the intervention’s target outcome are critical.
These design parameters include:
Intraclass Correlation Coefficients (ICCs)
ρ values that quantify achievement differences between clustersExplained Variances
R2 values that quantify the proportions of explained variance by covariates at the various levels
Generally, design parameters should match the peculiarities of the target research context as closely as possible (e.g., the target population of the intervention, the specific hierarchical data structure, and the achievement outcome under investigation). There are multiple resources of empirical values of ρ and R2. A review of existing international and German research on multilevel design parameters for student achievement can be found in Stallasch et al. (2021). A meta-analytic integration of both single- and multilevel R2 values is provided in Stallasch et al. (2023). A useful collection of respective estimates for the United States is the ‘Online Intraclass Correlation Database’ created by Larry V. Hedges and colleagues and hosted by the Institute for Policy Research at the Northwestern University.
Multilevel Design Parameters for the German School Context
In this workshop, we draw on our own compilation of ρ and R2 values (and corresponding standard errors) for the German school system published in Stallasch et al. (2021). Based on three longitudinal German large-scale assessments (NEPS, PISA-I+, and DESI) which provided achievement data across the entire school career (Grades 1 to 12), we generated design parameters that apply to:
Several student populations
Both two-level (students within schools) and three-level designs (students within classrooms within schools)
A broad array of domains
R2 values at each level are available for three covariate sets:
Pretest scores
Sociodemographic characteristics (comprising students’ gender and migration background, as well as parents’ educational attainment, and families’ HISEI)
The combination thereof
The design parameters are provided via an interactive Excel file (Supplemental Online Material B) that comes with a detailed introduction on the application scopes of the various sets of estimates. This document can be downloaded from the OSF or the Journal’s website.
To facilitate the workflow in R (e.g., to avoid time-consuming and error-prone C&P of estimates), an .rda file that encloses the full compilation of design parameters (as a list of data frames) is shared in this course’s repository on github which is ready to be directly loaded:
# load design parameters from github
load(url("https://github.com/sophiestallasch/2022-workshop-CRT/blob/main/data/multides1.rda?raw=true"))
If you run into problems, click here to download the data to your local machine and then load it into R.
# inspect list
summary(multides1)
Length Class Mode
B1_General 28 tbl_df list
B2_General_ND 14 tbl_df list
B3_Adjusted 28 tbl_df list
B4_Adjusted_ND 14 tbl_df list
B5_Academic 28 tbl_df list
B6_Academic_ND 14 tbl_df list
B7_Non-Academic 28 tbl_df list
B8_Non-Academic_ND 14 tbl_df list
B9_General-2l 20 tbl_df list
B10_General-2l_ND 10 tbl_df list
B11_Adjusted-2l 20 tbl_df list
B12_Adjusted-2l_ND 10 tbl_df list
B13_Academic-2l 20 tbl_df list
B14_Academic-2l_ND 10 tbl_df list
B15_Non-Academic-2l 20 tbl_df list
B16_Non-Academic-2l_ND 10 tbl_df listThe list contains 16 data frames, that can be grouped into two broad classes:
Point Estimates and Standard Errors
Data frames B1, B3, B5, B7, B9, B11, B13, and B15 contain the full sets of (population-specific) empirical estimates of design parameters for each domain, subdomain, and grade, along with their standard errors.Normative Distributions
Data frames B2, B4, B6, B8, B10, B12, B14, and B16 (all data frames ending with “_ND”) contain (population-specific) normative distributions (i.e., minimum, 25th percentile, median, 75th percentile, and maximum) of those design parameters summarized across domains and/or grades. These distributions can serve as guesstimates to plan studies whose target domain and/or grade is not covered in Stallasch et al. (2021).
Overview of Data Frames
| Data frame | Description | Grades | Scope of application | Target design | Hierarchical structure | ||
|---|---|---|---|---|---|---|---|
| L1 | L2 | L3 | |||||
| B1_General | Design parameters for the general (total) student population | 1-10 | Nationwide/ across all school types | 3L-(MS)CRT | Students | Classrooms | Schools |
| 11-12 | 2L-MSIRT/CRT | Students | - | Schools | |||
| B2_General_ND | Normative distributions of B1 | 1-10 | Nationwide/ across all school types; target domain and/or grade not covered | 3L-(MS)CRT | Students | Classrooms | Schools |
| 11-12 | 2L-MSIRT/CRT | Students | - | Schools | |||
| B3_Adjusted | Design parameters for the general (total) student population, adjusted for mean-level differences between school types | 5-10 | 1 school type in the non-academic track | 3L-(MS)CRT | Students | Classrooms | Schools |
| 11-12 | 2L-MSIRT/CRT | Students | - | Schools | |||
| B4_Adjusted_ND | Normative distributions of B3 | 5-10 | 1 school type in the non-academic track; target domain and/or grade not covered | 3L-(MS)CRT | Students | Classrooms | Schools |
| 11-12 | 2L-MSIRT/CRT | Students | - | Schools | |||
| B5_Academic | Design parameters for the academic track | 5-10 | Academic track school (“Gymnasium”) | 3L-(MS)CRT | Students | Classrooms | Schools |
| 11-12 | 2L-MSIRT/CRT | Students | - | Schools | |||
| B6_Academic_ND | Normative distributions of B5 | 5-10 | Academic track school (“Gymnasium”); target domain and/or grade not covered | 3L-(MS)CRT | Students | Classrooms | Schools |
| 11-12 | 2L-MSIRT/CRT | Students | - | Schools | |||
| B7_Non-Academic | Design parameters for the non-academic track | 5-10 | 2+ different school types in the non-academic track | 3L-(MS)CRT | Students | Classrooms | Schools |
| 11-12 | 2L-MSIRT/CRT | Students | - | Schools | |||
| B8_Non-Academic_ND | Normative distributions of B7 | 5-10 | 2+ different school types in the non-academic track; target domain and/or grade not covered | 3L-(MS)CRT | Students | Classrooms | Schools |
| 11-12 | 2L-MSIRT/CRT | Students | - | Schools | |||
| B9_General-2l | Design parameters for the general (total) student population; for two-level designs | 1-10 | Nationwide/ across all school types | 2L-MSIRT/CRT | Students | - | Schools |
| B10_General-2l_ND | Normative distributions of B9 | 1-10 | Nationwide/ across all school types; target domain and/or grade not covered | 2L-MSIRT/CRT | Students | - | Schools |
| B11_Adjusted-2l | Design parameters for the general (total) student population, adjusted for mean-level differences between school types; for two-level designs | 5-10 | 1 school type in the non-academic track | 2L-MSIRT/CRT | Students | - | Schools |
| B12_Adjusted-2l_ND | Normative distributions of B11 | 5-10 | 1 school type in the non-academic track; target domain and/or grade not covered | 2L-MSIRT/CRT | Students | - | Schools |
| B13_Academic-2l | Design parameters for the academic track; for two-level designs | 5-10 | Academic track school (“Gymnasium”) | 2L-MSIRT/CRT | Students | - | Schools |
| B14_Academic-2l_ND | Normative distributions of B13 | 5-10 | Academic track school (“Gymnasium”); target domain and/or grade not covered | 2L-MSIRT/CRT | Students | - | Schools |
| B15_Non-Academic-2l | Design parameters for the non-academic track; for two-level designs | 5-10 | 2+ different school types in the non-academic track | 2L-MSIRT/CRT | Students | - | Schools |
| B16_Non-Academic-2l_ND | Normative distributions of B15 | 5-10 | 2+ different school types in the non-academic track; target domain and/or grade not covered | 2L-MSIRT/CRT | Students | - | Schools |
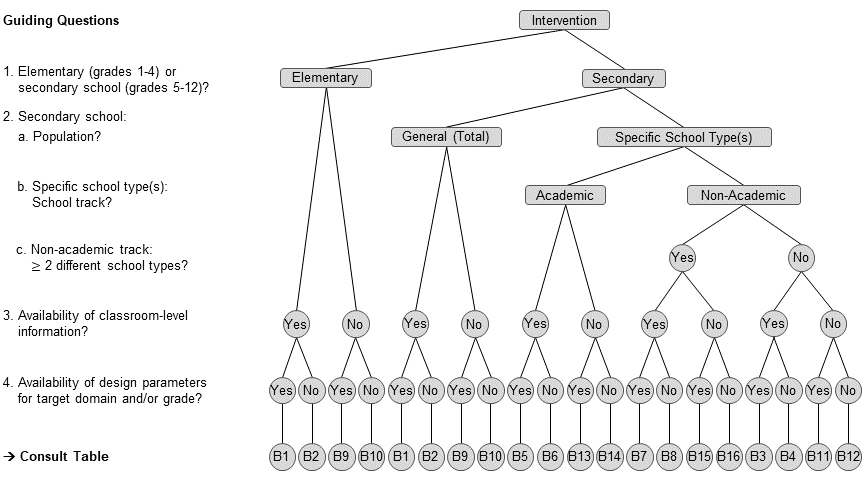
We also created a flow chart to guide the choice of appropriate design parameters as a function of key characteristics of the target intervention.
Structure of Data Frames
Data frames that contain the point estimates and standard errors (i.e., B1, B3, B5, B7, B9, B11, B13, and B15) are structured as follows.
| Variable | Description |
|---|---|
| domain | Domain of achievement outcome (for details, see section ‘Achievement Domains’) |
| subdomain | Subdomain of achievement outcome (for details, see section ‘Achievement Domains’) |
| grade | Grade of achievement outcome |
| study | Large-scale assessment study (and cohort): ‘NEPS-SC2’, ‘NEPS-SC3’, ‘NEPS-SC4’, ‘PISA-I+’, ‘DESI’ |
| wave | Wave of large-scale assessment study |
| model | Hierarchical structure of specified multilevel model: ‘3l’, ‘2l’ |
| icc_l2.est | ICC at the classroom level ρL2 |
| icc_l2.se | SE of ICC at the classroom level SE(ρL2) |
| icc_l3.est | ICC at the school level ρL3 |
| icc_l3.se | SE of ICC at the school level SE(ρL3) |
| r2_l1_pretest.est | Explained variance by a pretest at the student level R2L1 |
| r2_l1_pretest.se | SE of explained variance by a pretest at the student level SE(R2L1) |
| r2_l2_pretest.est | Explained variance by a pretest at the classroom level R2L2 |
| r2_l2_pretest.se | SE of explained variance by a pretest at the classroom level SE(R2L2) |
| r2_l3_pretest.est | Explained variance by a pretest at the school level R2L3 |
| r2_l3_pretest.se | SE of explained variance by a pretest at the school level SE(R2L3) |
| r2_l1_ses.est | Explained variance by sociodemographics at the student level R2L1 |
| r2_l1_ses.se | SE of explained variance by sociodemographics at the student level SE(R2L1) |
| r2_l2_ses.est | Explained variance by sociodemographics at the classroom level R2L2 |
| r2_l2_ses.se | SE of explained variance by sociodemographics at the classroom level SE(R2L2) |
| r2_l3_ses.est | Explained variance by sociodemographics at the school level R2L3 |
| r2_l3_ses.se | SE of explained variance by sociodemographics at the school level SE(R2L3) |
| r2_l1_pretestses.est | Explained variance by a pretest and sociodemographics at the student level R2L1 |
| r2_l1_pretestses.se | SE of explained variance by a pretest and sociodemographics at the student level SE(R2L1) |
| r2_l2_pretestses.est | Explained variance by a pretest and sociodemographics at the classroom level R2L2 |
| r2_l2_pretestses.se | SE of explained variance by a pretest and sociodemographics at the classroom level SE(R2L2) |
| r2_l3_pretestses.est | Explained variance by a pretest and sociodemographics at the school level R2L3 |
| r2_l3_pretestses.se | SE of explained variance by a pretest and sociodemographics at the school level SE(R2L3) |
Data frames that contain normative distributions (i.e., B2, B4, B6, B8, B10, B12, B14, and B16) are structured as follows.
| Variable | Description |
|---|---|
| domain | Domain of summarized parameters (for details, see section ‘Achievement Domains’) |
| grade_range | Grade range of summarized parameters |
| statistic | Summary statistic: ‘Minimum’, ‘25th Percentile’, ‘Median’, ‘75th Percentile’, ‘Maximum’ |
| icc_l2.est | ICC at the classroom level ρL2 |
| icc_l2.se | SE of ICC at the classroom level SE(ρL2) |
| icc_l3.est | ICC at the school level ρL3 |
| icc_l3.se | SE of ICC at the school level SE(ρL3) |
| r2_l1_pretest.est | Explained variance by a pretest at the student level R2L1 |
| r2_l1_pretest.se | SE of explained variance by a pretest at the student level SE(R2L1) |
| r2_l2_pretest.est | Explained variance by a pretest at the classroom level R2L2 |
| r2_l2_pretest.se | SE of explained variance by a pretest at the classroom level SE(R2L2) |
| r2_l3_pretest.est | Explained variance by a pretest at the school level R2L3 |
| r2_l3_pretest.se | SE of explained variance by a pretest at the school level SE(R2L3) |
| r2_l1_ses.est | Explained variance by sociodemographics at the student level R2L1 |
| r2_l1_ses.se | SE of explained variance by sociodemographics at the student level SE(R2L1) |
| r2_l2_ses.est | Explained variance by sociodemographics at the classroom level R2L2 |
| r2_l2_ses.se | SE of explained variance by sociodemographics at the classroom level SE(R2L2) |
| r2_l3_ses.est | Explained variance by sociodemographics at the school level R2L3 |
| r2_l3_ses.se | SE of explained variance by sociodemographics at the school level SE(R2L3) |
| r2_l1_pretestses.est | Explained variance by a pretest and sociodemographics at the student level R2L1 |
| r2_l1_pretestses.se | SE of explained variance by a pretest and sociodemographics at the student level SE(R2L1) |
| r2_l2_pretestses.est | Explained variance by a pretest and sociodemographics at the classroom level R2L2 |
| r2_l2_pretestses.se | SE of explained variance by a pretest and sociodemographics at the classroom level SE(R2L2) |
| r2_l3_pretestses.est | Explained variance by a pretest and sociodemographics at the school level R2L3 |
| r2_l3_pretestses.se | SE of explained variance by a pretest and sociodemographics at the school level SE(R2L3) |
Note that three-level design parameters (students at L1 within classrooms at L2 within schools at L3) were estimated for grades 1 to 10 only. For grades 11 to 12, no L2 estimates are available as 11th and 12th graders did not attend intact classrooms, but rather the grouping of students varied depending on the subject taught. Therefore, two-level design parameters (students at L1 within schools at L3) were estimated instead. Two-level equivalents for grades 1 to 10 (i.e., ignoring classroom-level clustering) are also provided; you can access them in the data frames labeled with ‘-2l’.
Keep in mind that the top level (which is always the school level) is consistently indicated as ‘_l3’ across all data frames; irrespective of whether L2 estimates were estimated (i.e., also for two-level designs).
Detailed information on the provided design parameters and underlying analysis models can be retrieved from Stallasch et al. (2021).
Achievement Domains
The design parameters cover the following achievement domains.
| Domain | Subdomain |
|---|---|
| Mathematics | Mathematics |
| Science | Science |
| Verbal Skills in German (as First Language) | Reading Comprehension |
| Reading Speed | |
| Spelling | |
| Grammar | |
| Vocabulary | |
| Writing | |
| Argumentation | |
| Listening Comprehension | |
| Verbal Skills in English (as Foreign Language) | Reading Comprehension |
| Text Reconstruction (C-Test) | |
| Language Awareness: Sociopragmatics | |
| Language Awareness: Grammar | |
| Writing | |
| Listening Comprehension | |
| Domain-General Achievement | Declarative Metacognition |
| ICT Literacy | |
| Problem Solving | |
| Basic Cognitive Functions: Perception Speed | |
| Basic Cognitive Functions: Reasoning |
Note that the (sub)domain character strings in the data frames are named exactly like shown here. For instance, if we want to filter design parameters for English text reconstruction from data frame B1, we could use the following code.
library(tidyverse)
library(kableExtra)
# filter English text reconstruction from data frame B1
eng_ctest <- multides1[["B1_General"]] |>
filter(domain == "Verbal Skills in English (as Foreign Language)",
subdomain == "Text Reconstruction (C-Test)")However, to avoid to type the full strings, better use pattern matching functions like from the grep() family instead that will do the job for you.
# better:
eng_ctest <- multides1[["B1_General"]] |>
  filter(grepl("Eng", domain),
         grepl("C-Test", subdomain))
Let’s have a look at the filtered design parameters.
eng_ctest |>
  # transpose for better readability
  t() |>
  kable() |>
scroll_box(height = "350px")| domain | Verbal Skills in English (as Foreign Language) | Verbal Skills in English (as Foreign Language) | Verbal Skills in English (as Foreign Language) |
| subdomain | Text Reconstruction (C-Test) | Text Reconstruction (C-Test) | Text Reconstruction (C-Test) |
| grade | 9 | 9 | 9 |
| study | DESI | DESI | DESI (Pooled) |
| wave | 1 | 2 | NA |
| model | 3l | 3l | 3l |
| icc_l2.est | 0.07484727 | 0.09329552 | 0.08274759 |
| icc_l2.se | 0.009634811 | 0.011132797 | 0.007285329 |
| icc_l3.est | 0.5839861 | 0.5519840 | 0.5687772 |
| icc_l3.se | 0.01762045 | 0.01851544 | 0.01276421 |
| r2_l1_pretest.est | NA | 0.4270869 | 0.4270869 |
| r2_l1_pretest.se | NA | 0.007683032 | 0.007683032 |
| r2_l2_pretest.est | NA | 0.8440895 | 0.8440895 |
| r2_l2_pretest.se | NA | 0.01575307 | 0.01575307 |
| r2_l3_pretest.est | NA | 0.998872 | 0.998872 |
| r2_l3_pretest.se | NA | 0.0006166911 | 0.0006166911 |
| r2_l1_ses.est | 0.01315652 | 0.01675238 | 0.01483982 |
| r2_l1_ses.se | 0.002402910 | 0.002561325 | 0.001752443 |
| r2_l2_ses.est | 0.6742777 | 0.6423608 | 0.6577857 |
| r2_l2_ses.se | 0.09820881 | 0.09497836 | 0.06827333 |
| r2_l3_ses.est | 0.8845148 | 0.9068157 | 0.8968653 |
| r2_l3_ses.se | 0.01972262 | 0.01770283 | 0.01317418 |
| r2_l1_pretestses.est | NA | 0.4306028 | 0.4306028 |
| r2_l1_pretestses.se | NA | 0.007663661 | 0.007663661 |
| r2_l2_pretestses.est | NA | 0.8838199 | 0.8838199 |
| r2_l2_pretestses.se | NA | 0.01990558 | 0.01990558 |
| r2_l3_pretestses.est | NA | 0.9993725 | 0.9993725 |
| r2_l3_pretestses.se | NA | 0.000219044 | 0.000219044 |
As can be seen, there are three entries for English text reconstruction as the respective test was administered to students at two time points in the DESI study, namely at the beginning and at the end of grade 9. For the beginning of grade 9, no pretests were available, therefore the corresponding cells are set to NA. A third set of estimates is provided here that contains the meta-analytically pooled results across these two time points (as indicated by ‘DESI (Pooled)’). Note that this integration strategy (applying a fixed effect model approach) was also adopted for other domains in grade 9 in case multiple design parameters were available (as obtained either from several studies [as indicated by ‘All (Pooled)’] or from the two time points in DESI).
Advanced Covariate Selection for Single- and Multilevel Designs
Well-chosen covariates can dramatically boost power and precision in both IRTs and CRTs. Recently, we generated an extensive compilation of single- and multilevel R2 (and ρ) values for student achievement (Stallasch et al., 2023). Alongside three psychometric heuristics, we analyzed (a) covariate types of varying bandwidth-fidelity, (b) covariate combinations to quantify incremental validities , and (c) covariate time lags of 1–7 years to test potential validity degradation in the covariates. We meta-analyzed the estimates from six quasi-representative German samples, covering various outcome domains and the entire school career. We also used the estimates to simulate precision. We won’t use these design parameters in the present workshop. However, feel free to check out our preprint and the corresponding Online Supplemental Material for manifold illustrative scenarios of study planning.